The major components of a process map include the inputs, outputs, and the steps in the process. A high-level process map in Six Sigma should illustrate the flow of the work and the interaction with the organization. It should make use of a common language (symbols) that are easily understood by everyone. An ideal process map should contain proper detail with respect to multiple paths, decisions, and rework loops.
Process Mapping is an important lean method that we use in Lean Six Sigma projects. This article will cover all the tips and tricks which will help you successfully understand Lean Six Sigma Process Mapping for your process and clear the Lean six sigma certification exam.
This article is a brief introduction to Lean Six Sigma Process Mapping. If you want in-depth knowledge and practice, you should join the Lean Six Sigma Green Belt certification course where you will learn how to use process mapping practically.
Anexas Lean Six Sigma Green Belt certification course offers comprehensive training in process mapping. In live interactive sessions, our expert trainers use examples and projects to train participants in the use of process maps. With the course material, you can also get access to Six Sigma process map template- excel to practice.

What is Process Mapping?
A Process mapping is used to identify all of the steps and decisions in a process in graphical form, with a view to continually improving that process. There are many different types of maps, each designed to capture particular aspects of work. One can identify the major areas of value added and non-value-added activities in the existing process, such as the contribution of each step in the process
Types of Process Maps in Six Sigma
There are various types of process maps in Six Sigma that serve different purposes in analyzing and improving processes.
- SIPOC (Suppliers, Inputs, Process, Outputs, Customers) map, which provides a high-level overview of the process and its key stakeholders.
- Value stream maps are used to identify and eliminate non-value-added steps, improving the overall flow and efficiency.
- Flowcharts, on the other hand, offer a detailed step-by-step representation of the process, highlighting decision points and potential areas of waste.
- Swimlane maps are effective in depicting the responsibilities of different individuals or departments involved in the process.
- Spaghetti Map uses lines or arrows to track the physical movement of people, materials, or information within a process, helping to identify unnecessary movement or congestion.
- Scatter Plot is a graphical tool used to identify potential relationships or correlations between two variables, helping to understand process performance or identify root causes of variation.
Each type of high-level process map in Six Sigma offers unique insights and helps organizations identify opportunities for optimization and achieve sustainable process improvements.
Why Map a Process?
The Lean Six Sigma Process mapping provides a visual representation of the process being studied. It allows a team to identify opportunities for improvement, provides a common understanding of the roles within the process and sets “the stage”/platform for the improvement process and it is an important part of the Measure phase in DMAIC.
Mapping enables organizations to clearly define the current processes in chart form to identify
- Inputs and outputs
- Bottlenecks/batching
- Capacity issues
- Delays or waste
- Potential for errors/% accuracy
Fundamentals of Process Mapping and their steps
A process map should be reviewed frequently and is never done. A high-level process map in Six Sigma should document how the process operates, not how it is supposed to operate. (“As is” not “To be”). A process map will identify opportunities for service and quality improvements.
Process Mapping Steps
- Start with the “Supplier, Inputs, Process, Outputs, and Customer” (SIPOC) diagram.
- Review the process and boundaries.
- Identify the type of process map.
- Identify the steps and their sequence.
- Walk the process forward to see what happens.
- Walk the process backward to ask “Why” questions.
- Watch the process.
- Keep a list of ideas as you work.
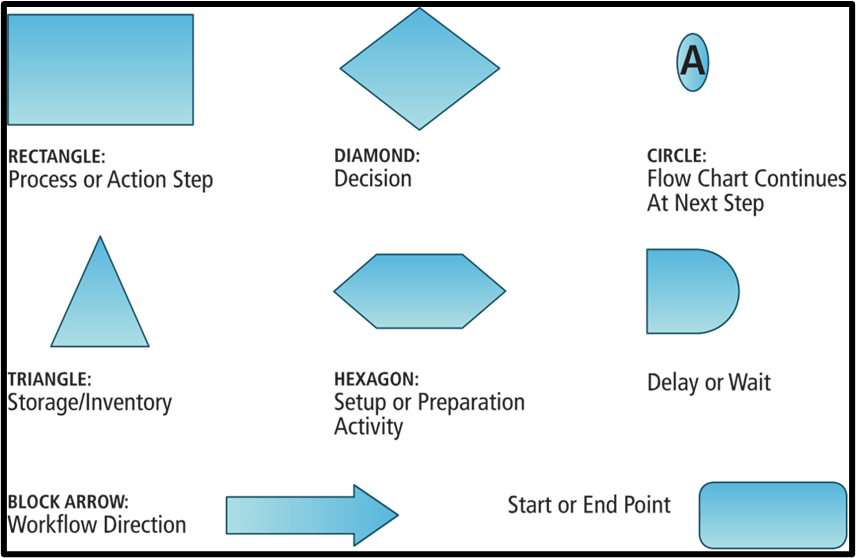
Process Mapping Symbols
With process flow maps, we use standard symbols to depict the detail of the map. A rectangle typically represents a process or action step. The diamond usually indicates an area where a decision is needed that will lead to different paths. If the map is interrupted on a separate page or area, a circle around a letter is used to show where the process stops and the corresponding point where the process picks back up. A triangle is used to show storage or inventory. A hexagon is used to show a set-up or preparation activity. A filled ‘D’ shape usually is an indication of a delay or wait. A block arrow is an indication of workflow direction. A rectangle with rounded corners is an indicator of a process start and end.
Process Flow Map Symbols given in the below picture
How to Find a Hidden Process?
If we investigate each process in the system, we can understand the waste that is often built in. In this Lean Six Sigma process map example, the hidden process of waste is uncovered by mapping the detailed steps of the process.
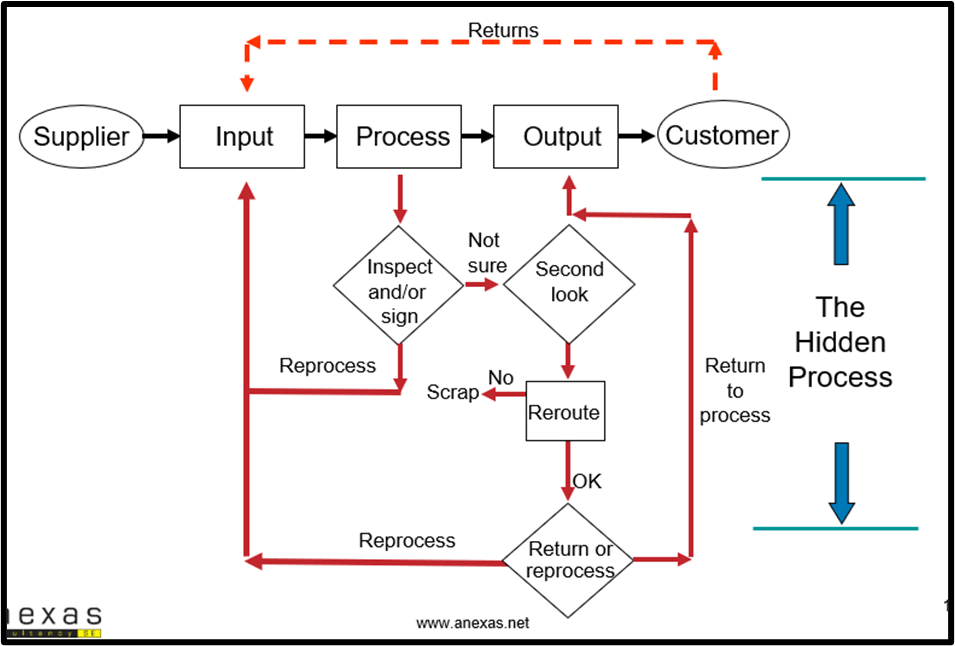
One of the quality guru Dr. Edward Deming said that “If you can’t describe what you’re doing as a process, then you don’t know what you’re doing.” By mapping organization processes, you can identify those hidden inefficiencies. Lean Six Sigma Process mapping is a systematic way of documenting the steps and time required to complete a task. Why process maps? Because companies’ bottom-line will improve. Customers will only pay for products and services that add value for them. Process mapping in Lean Six Sigma Green Belt certification saves cost by eliminating processes that provide no benefit to customers.
Lean Six Sigma Process Map Example
A Lean Six Sigma process map example illustrates the steps and flow of a process, highlighting areas for improvement and efficiency. Process mapping allows teams to gain a clear understanding of the current state, identify pain points, and implement targeted improvements. With a Lean Six Sigma process map example, organizations can drive continuous improvement and enhance overall performance. Let us understand process mapping with the examples below:
Example of Process Mapping 1
As is process map is created after Gemba walk on the procurement process with help of cross functional departments operations, purchasing, suppliers and finance for identifying non-value-added activities
As is Process Map for Procurement Process given below
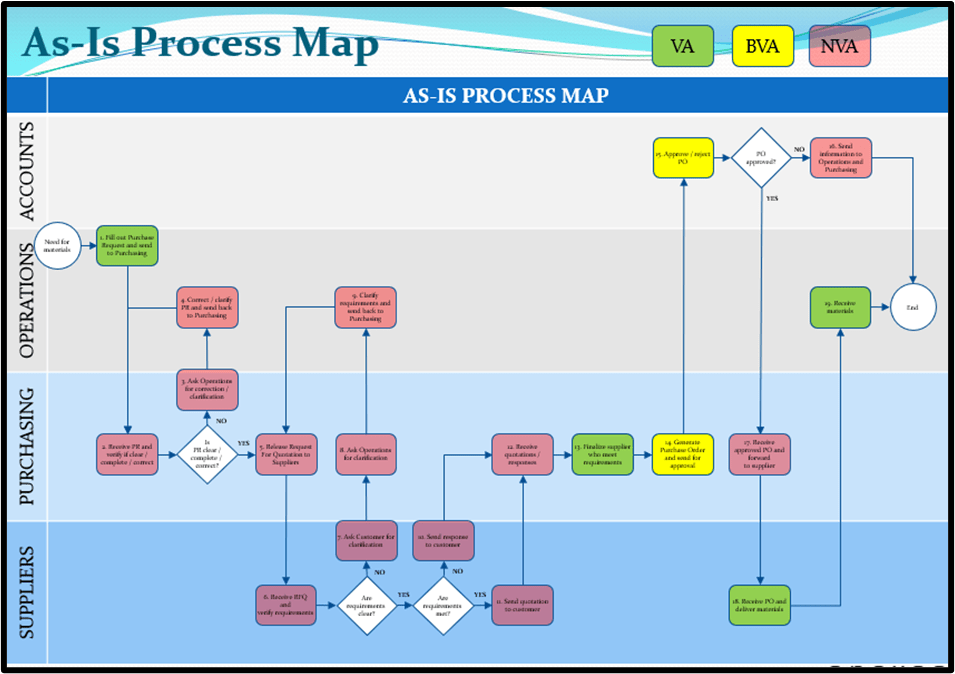
Cross functional team were taught actual processes to receive the request and place the order and get the item from the supplier and hand over the items to the operation department. But when they mapped the process after Gemba investigation, they found repetitive verification process steps, rework process steps are happening. There are two main reasons for delay in procurement time such that specification is not clear and purchase order approval delay.
Example of Process Mapping 2
As is process map is created after Gemba walks on the patient discharge process with help of cross functional departments admissions, record keeping, physician, pharmacist, and patients, As- is process map helps to identify the wasteful process steps in patient discharge process.
Process Mapping for Patient Discharge Process is given below
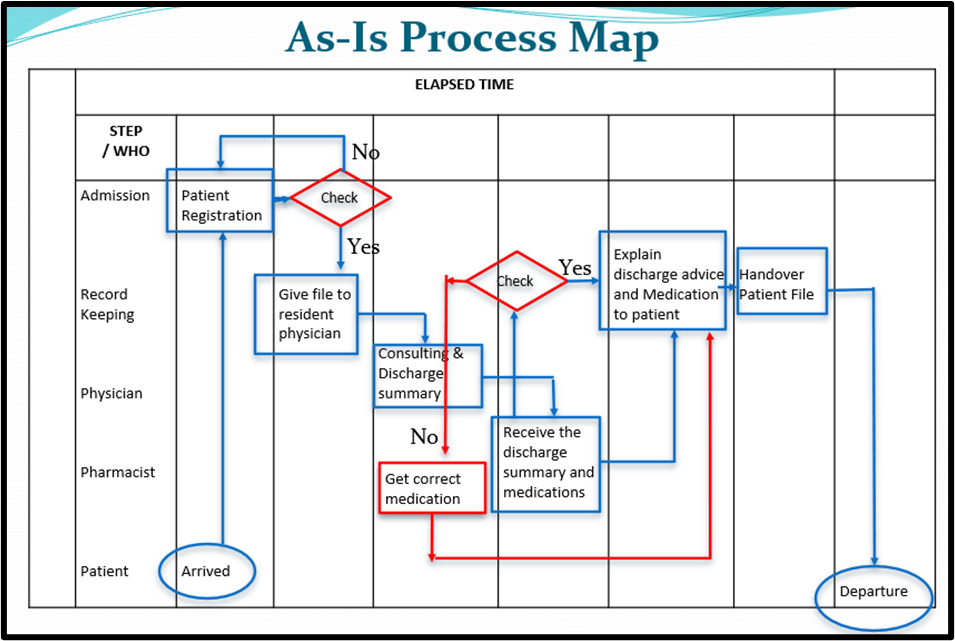
Cross functional team were taught actual processes steps are patients arrive and get the patient file and consult with physician and collect discharge summary and medication the departure from hospital. But when they mapped the process steps after the Gemba investigation, they found repetitive verification process steps, rework process steps are happening. There are two main reasons for delay in discharge are waiting at receiving a patient file and rework activity due to medication error.
Finding Happy Path through Process Mapping
For a DMAIC project, you can take the regular process map, reorganize it and enhance it. This process map shows the first part of the process for making a photocopy. The value-added steps have been moved to the left side of the vertical line and the non-value-added steps were arranged on the right side of the line. The straight-down-the-page flow on the left is sometimes called the “Happy Path,” because this is what happens when everything goes “right the first time.” By separating the non-value-added steps, it is easier to see opportunities for improvement. Without the waste and complexity, the process is simple and straightforward.
The Happy Path is the value stream given below
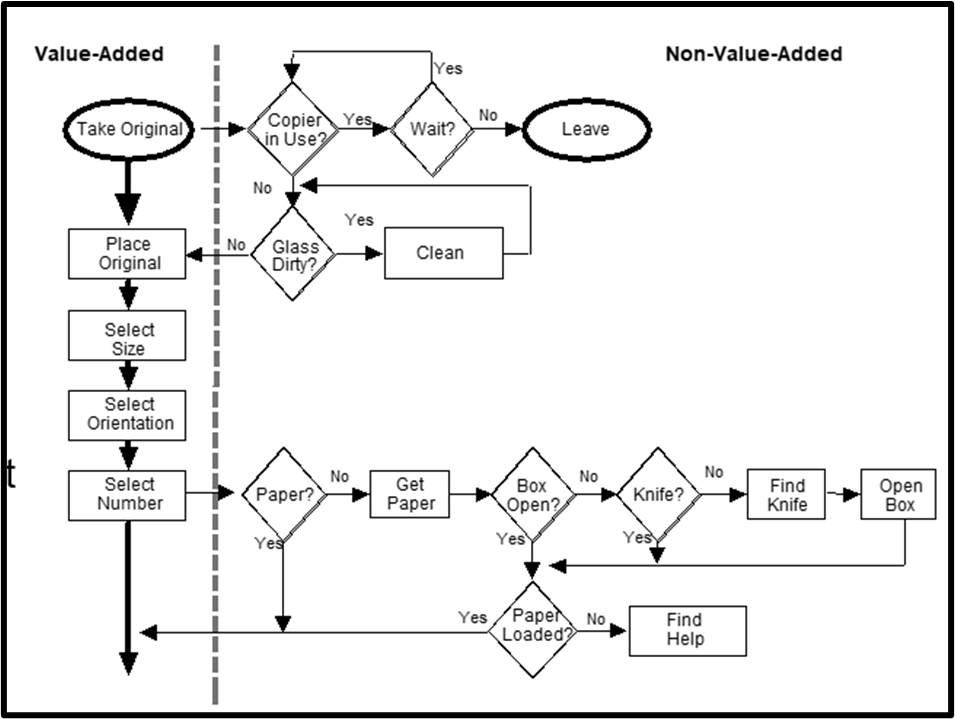
In the above process map, the left side are all those steps and only those steps necessary to deliver an acceptable product to the customer.
Please answer simple questions given below then compare your answers
Process Mapping – Example exercise 1
What do are benefits flowchart provide ___________
- understand the scope of a process
- identify process steps
- identify VA and NVA at later stage
- all the above
Process Mapping – Example exercise 2
What is the first benefit, that flowcharts provide is
- identify wasteful steps
- increase understanding of what is taking place
- identify redundancies
- to assist with ISO compliance
Process Mapping – Example exercise 3
Which process steps are called as essential?
- value added
- non-value added
- waste
- all the above
Answers for skills building exercises
- Answer for the first sample exercise is: 4
- Answer for the second sample exercise is: 2
- Answer for the third sample exercise is: 1
Conclusion
When developing process mapping, walk the process. There are always gaps between what you think your process is and what it actually is. The only way to determine the true current state ‘as is’ view of the process is to walk the process. Another way of generating the process flow map is to assemble a cross-functional team to develop the map. Input from the process owners, customers, suppliers, and other stakeholders is necessary. Some inputs to the process flow map are the process documentation, process owner experience, and the process fishbone or cause and effect diagram. Process flow maps are visual representations of the detailed workflow within a particular step of a value stream map. They show detailed workflow and help us uncover root causes. The value stream map provides focus, and the process flow map provides the detail.
Also read: Box Plot in Lean Six Sigma Green Belt Certification