A Pareto analysis is one of the seven basic tools of quality control. It is important for engineers of quality management to know how to make a Pareto chart in Lean Six Sigma and interpret it for problem solving.
This article will cover all the tips and tricks which will help you successfully understand the Pareto analysis for your process and clear the Lean six sigma certification exam
What is Pareto analysis?
A Pareto analysis is a graphical tool that helps you break a big problem down into its parts and identify which parts are the most important. A Pareto Chart is a graph that indicates the frequency of defects, as well as their cumulative impact. Pareto Charts in Lean Six Sigma are beneficial to find the defects to prioritize in order to observe the highest overall improvement.
Origin of Pareto Analysis
The Pareto Principle was an observation of a famous Italian economist named Vilfredo Pareto. He was trying to analyse the distribution of income amongst the population of Italy. That is when he observed that 80% of the land in Europe was owned by 20% of the population, and that the remaining 20% of land was owned by the remaining 80% of the population. He observed that it seemed to be universally correct and this principle was named as the Pareto Principle in his honour.
Some important impact of Pareto Principle are:
- Dr. Joseph Juran popularized this principle by showing that it applied in a variety of situations, especially quality problems.
- Applying this principle in the workplace means we will get the biggest payoff for our efforts if we focus on the “vital few” problems.

How does Pareto analysis work?
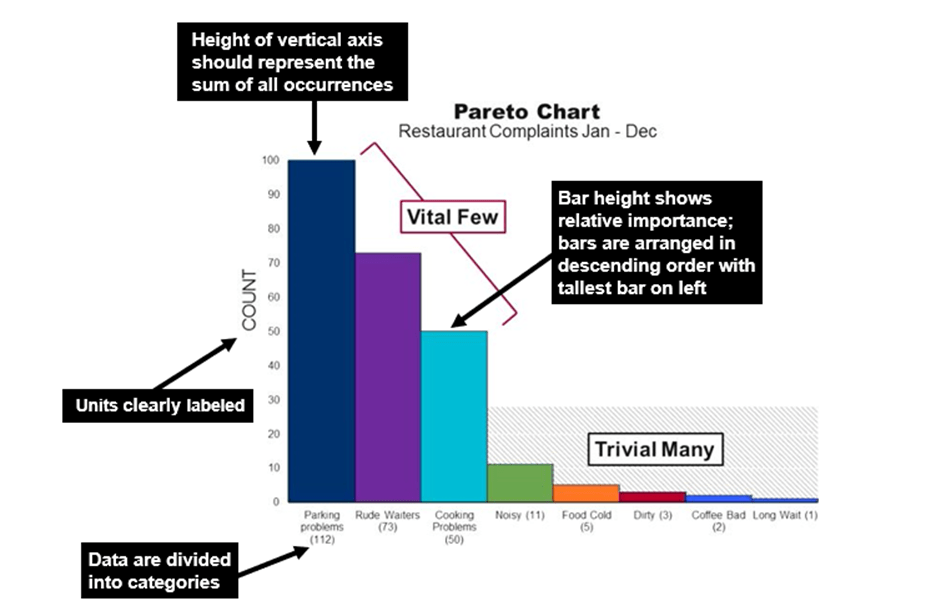
The implications of the Pareto Principle are profound. The Pareto Principle states that doing 20% of the things right will give you 80% of the results you desire. It is a process of segregating the vital few from the trivial many and working on the vital few to get the best results. The words “vital few” and “trivial many” were at the centre of the Pareto philosophy
The Pareto analysis, or Pareto principle, is also known as the 80/20 rule because it is based on the idea that 80% of a project’s benefit can come from doing 20% of the work. Conversely, 80% of a situation’s problems can be traced to 20% of the causes.
Thus, managers use Pareto Principle and segregate the:
- 80% of the benefits of a device are derived from 20% of the product features.
- 80% of your revenue comes from 20% of your customers.
- 80% of non-conformances are generated from 20% of your root causes.
Pareto Analysis Benefits
A Pareto chart helps you decide where your improvement efforts will have the biggest payoff. Ultimately, you are trying to uncover clues that will help you pinpoint causes. You can use a Pareto chart only when the problem under study can be broken down into categories and the number of occurrences can be counted for each category.

Key points to remember while using Pareto analysis
- Understand the pattern of occurrence for a problem
- Judge the relative impact of various parts of a problem
- Track down the biggest contributors to a problem
- Decide where to focus efforts
How to construct pareto chart
- First collect all the relevant data & categorize them into groups.
- Label the left side of the Y-axis as Frequency.
- Label the right side of the Y- axis as Cumulative percentage
- Categories of data are arranged in a descending order of the factors starting from the left side on the X- axis. Then a cumulative frequency line is plotted which is ascending and flattens off at the end.
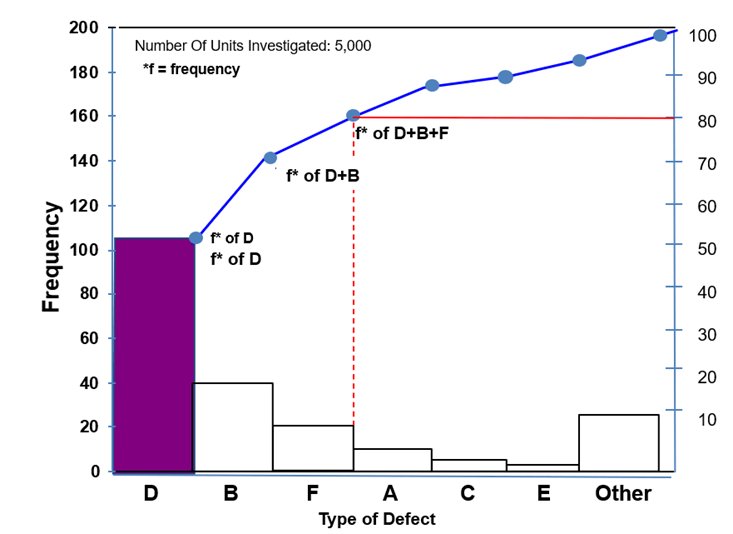
- The height of each bar in the chart represents the frequency of defects. From the chart one can visualize the critical factors which vital few are differentiating from the rest which are trivial many. Hence it is called vital few & trivial many techniques. The cumulative percentage line is used to estimate the contribution of each level of factors/defects.
- The focus is then shifted to vital few factors & further analysis is carried out to find the best solution and then implemented making significant difference in the process improvement.
Example of Pareto Analysis 1
Profit margins are critical in the grocery business. Anything you can do to eliminate waste has a direct influence on the bottom line. One large grocery store wanted to reduce the amount of money wasted through spoiled food, which obviously could not be sold to the public.
The supervisors of various departments were all clamoring that their problem was the worst and should be addressed first. Where should the store focus its attention? They examined records for the past three months and created the Pareto chart above.
Example of Pareto Analysis 2
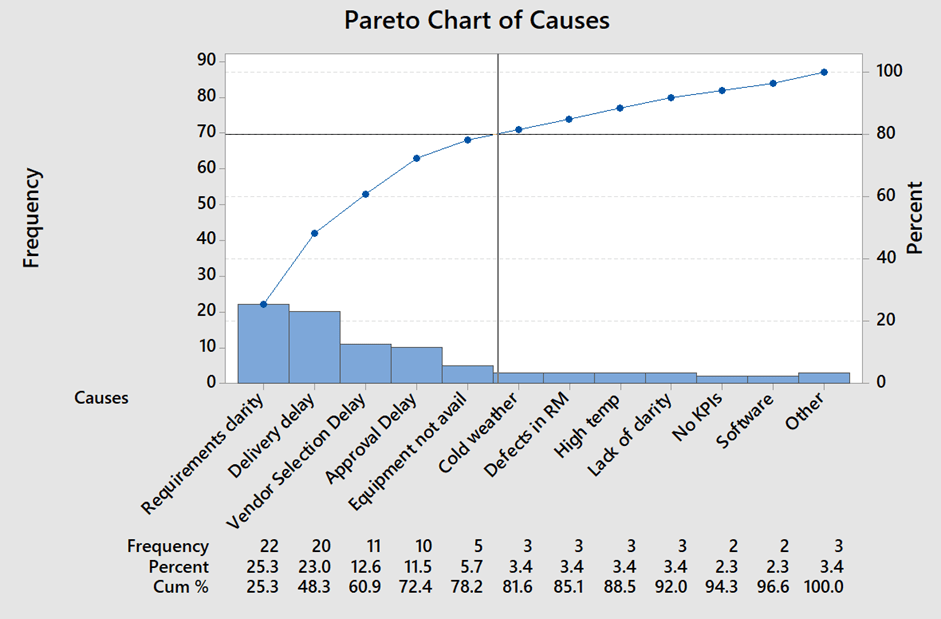
- Purchase manager wants to reduce procurement cycle time which leads to customer dissatisfaction.
- The purchasing team has collected reasons for delay from purchase records of 15 purchase orders.
- Based on collected data, the team has identified more important reasons for procurement delays are requirements clarity, delivery delay, vendor selection delay, approval delay and equipment not available.
Example of Pareto Analysis 3
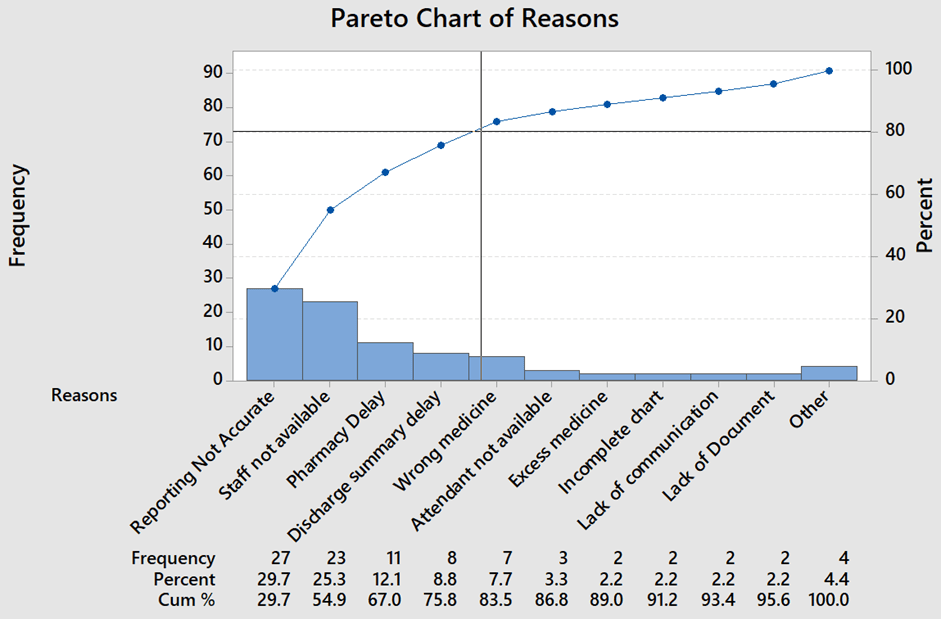
- Hospital director wants to reduce patient discharge time which leads to patient dissatisfaction due to more waiting time.
- The hospital team has collected reasons for delay from patient records of 15 patients’ records.
- Based on collected data, the team has identified more important reasons for patient discharge delays are reporting accuracy, staff not available, pharmacy delay and discharge summary delay.
Please answer simple questions given below then compare your answers
Pareto Analysis – Example exercise 1
In a Pareto Chart, the line connecting various cumulative points using is ______
- ascending
- descending
- vertical
- horizontal
Pareto Analysis – Example exercise 2
The Pareto Principle suggests that importance is placed on
- the vital many (many important)
- the trivial few (many unimportant)
- the trivial many (Many causes)
- the vital few (few root causes)
Pareto Analysis – Example exercise 3.
_________ refers to the variables that are least likely responsible for variation in a process, product, or service
- Vital Causes
- Vital Few
- Trivial Many
- All of the above
Answers for skills building exercises
- Answer for the first sample exercise is : 1
- Answer for the second sample exercise is : 4
- Answer for the third sample exercise is : 3
Conclusion
Pareto diagrams and tables are presentation methods used to show the evidence and separate the vital few from the trivial many. They are widely used to help project teams and quality steering committees make important decisions at various points in the Root cause analyses sequence. The Pareto chart’s main target is to highlight the vital data among the bulk set of data. In the Pareto chart, the 80/20 rule explains that 80% of the results are calculated with 20% of the causes. Sometimes we can not believe the pareto chart alone, further collecting data to identify the relationship between causes and problems by doing scatter plot and box plot.
Also read the other article: Lean Six Sigma: Value Stream Mapping