
This article will cover all the tips and tricks that will help you successfully draft and analyze the value stream map. A value stream comprises all the actions required, both value-added and non-value-added, to run a product or service to completion. It can be applied to any industry, product, or service.
What is Value Stream?
VSM originated as Toyota’s lean production system in Japan. It was originally called “material and information flow”. This method was documented in the US in 1999 as “Value Stream Mapping”. Value stream in any organization is the set of activities that add value for the customers from the initial request through the realization of value by the customers. By showing the flow of material or information, wastes are easier to identify and eliminate.
Utilizing value stream mapping tools, businesses can effectively visualize and optimize their processes, thereby enhancing efficiency and reducing waste. Through value stream mapping training, teams are empowered to identify bottlenecks, streamline workflows, and drive continuous improvement in their operations. The value stream mapping template offers a structured framework, allowing organizations to seamlessly chart out their processes and pinpoint areas for improvement.
According to the book Lean Thinking by Womack and Jones, 1996–
“The value stream is the entire set of activities required to bring a product or service into the hands of the customer.”
It is important to note that in any organization:
- Products and services are produced by the process and its interrelationship with different functions, so it is important to focus on the process.
- Some of these processes tend to be the way customers identify with the company.
- Functions are (or should be) the residence and building place
for competencies. - Process capabilities and competencies are the key leverage points to achieve strategy (desired state of the organization).
How to make a lean value stream map?
The lean value stream map has a resemblance with the high-level process map i.e., SIPOC diagram (insert link) which means Supplier, Input, Process, Output, and Customer. Many lean practitioners see VSM as a fundamental tool to identify waste, reduce process cycle times, and implement process improvement. One can easily make a value stream map using the template provided in the below section. Elements of a comprehensive value stream map are:
Supplier capabilities:
Supply capabilities are defined as any 3rd party vendor or company that supplies raw material or service to the organization that has a certain level of capability which is mentioned in the value stream map; capabilities such as manufacturing capacity, throughput time, yield and quality of the supplier.
Process requirements and timing
Process requirements are defined as the requirements of raw material and inputs to execute the process. Generally, the process requirement is mentioned in the value stream map such as raw material requirements, input delivery schedule, and inventory details.
Process performance data
Process performance data contain cards mentioning all the process performance details of each step involved in the process such as number of manpower involved in the process, total cycle time, changeover time, available time, number of shifts, and efficiency.
Customer requirements
Customer requirements are generally mentioned in the output section of the VSM. It contains all the details which are required for desired output by the customer, product characteristics and service requirements, frequency of the delivery requirement from the customer and frequency of delivery vehicle
Required production control/service scheduling information
Production control and scheduling and planning work as the brain of the process. It takes all the decisions about the planning and processing scheduling and communicates to each component of the process planning and scheduling team communicates with supplier-customer and process.
Indication of how the product/service flow is pulled and levelled through the processes
Different arrows denoted in comprehensive VSM indicate product/service flow and its direction
Stated objectives of total efficiency
Total efficiency of a process can be calculated by analysing the non-value adding activities and value-adding activities which are represented by zigzag step lines and the efficiency is calculated but the dividing value at a time by 2 total cycle time taken in the process
12 Tips for making a comprehensive VSM
- Identify Supplier, inputs, process, and output before making VSM.
- VSM is a paper-pencil technique, therefore draft VSM on a sheet of paper.
- Always take buy-in from a Subject matter expert (SME) while making a comprehensive VSM because it involves lots of process details that may need guidance.
- Use templates provided in the VSM example section as per suitability.
- The value-added and non-value-added time should be calculated and validated with respect to the actual process. It is better to use a stopwatch and do a cycle time study before VSM.
- Always refer to organizations’ SOPs to validate the flow of information and material that doesn’t deviate from the SOPs
- Consult with the planning and scheduling team of your organization for the authenticity of the information and material flow frequencies in the VSM
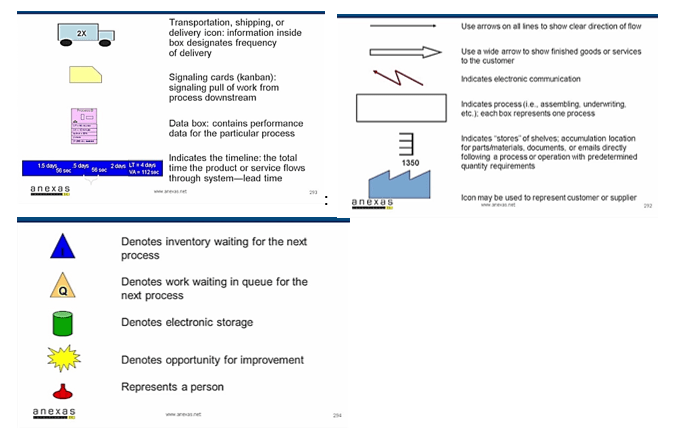
- Value stream maps use symbols as abbreviations, be careful while using the symbols, as different arrow types have different meanings.
- Don’t worry about the industry for which you are making VSM. Basic symbols can be used for any value stream, whether manufacturing, administrative, transactional, or any other
- Some symbols may be generic for a particular type of industry and used specifically for that industry only.
- Some organizations have symbols that are specific to
that organization. - Following are the symbols that can be used to denote various elements of VSM:
Value Stream map examples
A comprehensive value stream map can be made using symbols explained in the previous section. It shows all the material and information flow throughout the value chain and helps in studying the complete ecosystem of the process to find out the opportunity for improvements and to increase the process efficiency.
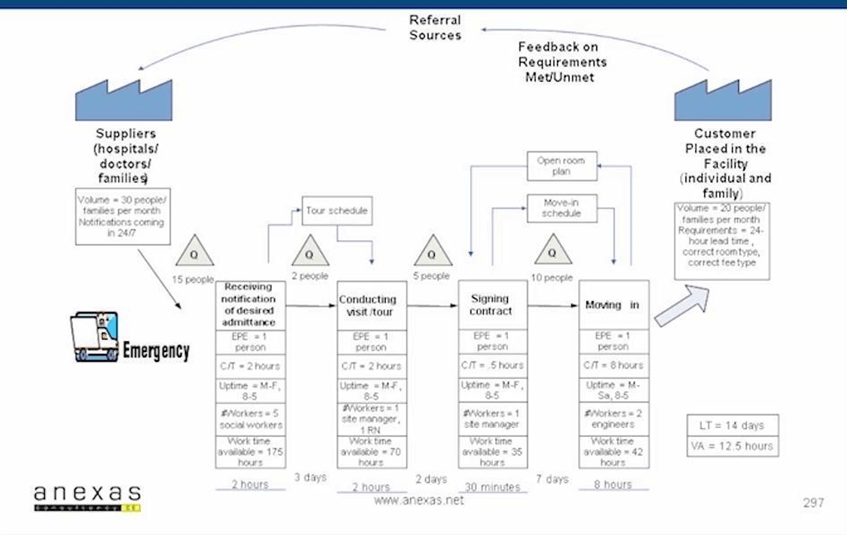
VSM in healthcare
Following is an example of a comprehensive value stream map for the healthcare industry. If you look carefully at the following diagram, the suppliers are the hospital, doctors, and families. There are different steps involved in the process like receiving notice, conducting a visit, signing a contract, and moving in. There are queues involved in the process which contributes to the waste of waiting in the process. After completion of the process, the customer is placed in the facility. After the service, the customer gives feedback and requirements to the referral source. The referral source then sends this information to the supplier (hospital) and this is how the system works. Below is the summarised value stream map offered in the healthcare industry:
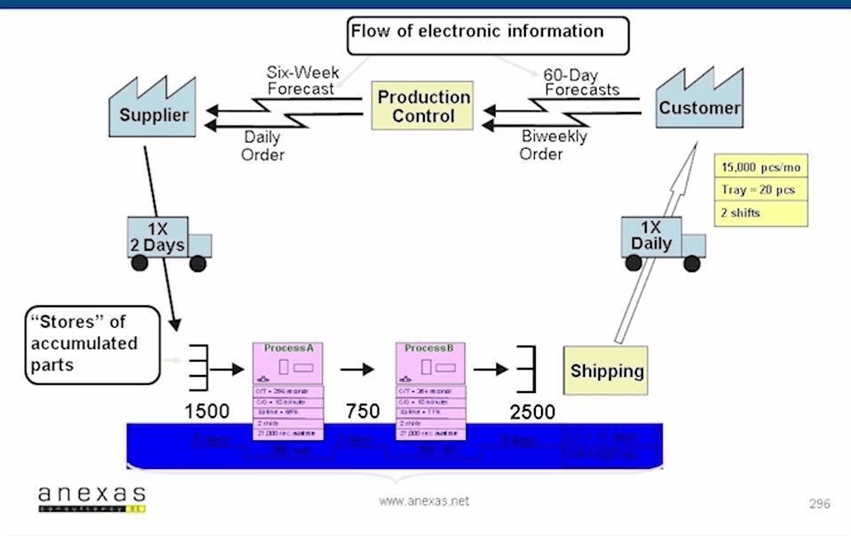
VSM in Manufacturing
Following example shows the value stream map for the manufacturing industry. Raw materials are being procured from the supplier once every 2 days. There is a capacity of 1500 inventory at the input stage. There is a two-step process of manufacturing, whose performance data is given in the performance card. Output-end has an inventory of 2500 units. Shipping is done once every day. The customer is giving a 60-day forecast to the planning team and sending weekly order demand-supply. The planning team is giving 6 weekly forecasts and daily orders for RM. The information is summarized in a comprehensive VSM below:
VSM in the sales industry
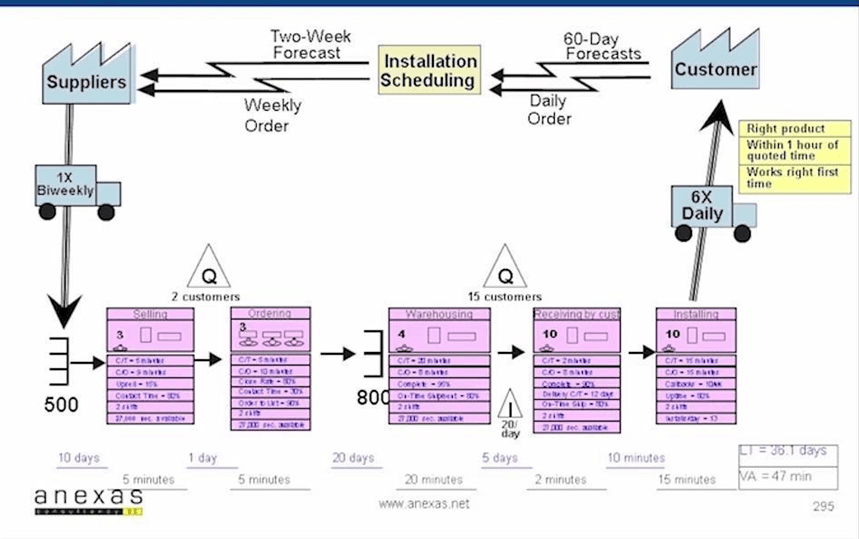
Following is an example of a comprehensive value stream map of a sales industry. VSM for appliance sales and installation, where the installation and scheduling department will give 2 weeks forecast and the weekly orders to the suppliers. Then suppliers transport the raw materials, and the raw material is stored. So here we can see the suppliers are indicated by the factory symbol and the transportation is indicated along with the frequency as a truck. Then the raw material is unloaded to the storage and this storage supplies the raw material to the selling, ordering, warehousing, receiving by the customer, and installation. In the sale, you can see the data box indicates that cycle time is 5 minutes, changeover time is 9 minutes, absolute 15% contact time is 80% and they operate in 2 shifts and the available time here for operations is 27,000 seconds. So similarly, all the data boxes indicate the details of each process step. One queue indicates that 2 customers are there, and another queue indicates that there are 15 customers waiting for the next step to start operating. We have inventory icons. You can see the triangles with a high return in them which is 20 per day and if you look at the bottom you will see that the timelines are indicating that 10 days is the waiting period before selling starts. The selling takes 5 minutes then between selling and ordering you have one day gap and then ordering takes 5 minutes and similarly, you have got the waiting times of 20 days etc for each of the process steps indicated. Finally, from installation, it goes to the customer by vehicle.
Example Exercise1:
Which method of analysing a detailed flow chart is suitable for identifying physical inefficiencies?
Which method of analysing a detailed flow chart is suitable for identifying physical inefficiencies?
- SIPOC
- Flow chart.
- Value stream map.
- Project charter.
Answer: Option C) Value stream map in any organisation is the set of activities which add value for the customers from the initial request through the realization of value by the customers. By showing the flow of material or information, wastes are easier to identify and eliminate.
Example Exercise2:
What are the benefits of a value stream map?
- Creates a common understanding of how value is produced.
- Shows performance data
- Visually identifies where waste occurs.
- All of these.
Example Exercise3:
Which of the following statement is correct:
- VSM generally contains more information than any other process map.
- Value stream map only considers Value-adding activities.
- Solid wide arrow symbol used to show material/service flow to the customer.
- a and b
- b and c
- c and a
- Only c
Answer: Option C) is correct.
Statement a.) VSM generally contains more information than any other process map. Is correct.
Statement b.) The value stream map only considers Value-adding activities. Is incorrect because VSM considers all the process steps involved in a process be it VA or NVA.
Statement c.) The solid wide arrow symbol used to show material/service flow to the customer. is correct.
Conclusion
The value stream is the entire set of activities required to bring a product or service into the hands of the customer1 From Lean Thinking, Womack, and Jones, 1996. Value streams are typically created for a single product or service family. A current state map makes the flow of work visible and helps us see the waste. Value stream maps may look very different depending on the value stream and the industry. Implementing value stream mapping software enables businesses to digitally visualize and analyze their entire workflow, leading to more informed decision-making and operational enhancements. While both value stream mapping and process mapping aim to improve efficiencies, the former focuses on the flow of value and waste elimination, whereas the latter zeroes in on the detailed steps of a specific process.
Value stream maps are future-oriented therefore the future state value stream maps are used after finding the lean solution for implementation. The value stream map gives benefits such as:
- Broader range of information can be gathered and displayed.
- Broader scope (from door to door).
- Typically, a higher-level view than most process maps.
- Value stream map is Future-oriented and emphasizes improvement by elimination of waste in the process.
- VSM is used as a strategic business planning tool to manage a change process.
Also Read: Lean Six Sigma Green Belt: Cause-and Effect-Diagram