Dr. Kaor Ishikawa invented the Cause-and-Effect diagram. He developed a straightforward method of displaying the causes of an issue, this diagram went on to be referred to as the Ishikawa or Fishbone Diagram.
What is Cause-and-Effect Diagram?
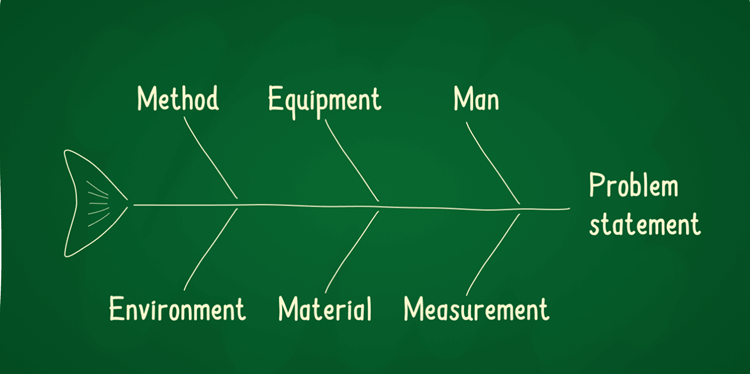
Cause-and-Effect diagrams are a brainstorming tool that shows the construction of a specific output. A Cause-and-Effect diagram allows a simple but logical process of elimination which leads to faster problem resolution, ensuring your business reduces defects and increases productivity. Causes are then reduced again and again until you can separate the probable outcome or means to an end. Cause-and-Effect diagrams inherited their name from the outline-like design that resembles a fish skeleton. This is a casual way to evaluate a situation and framework about what the cause of the problem could potentially be.
What is the main purpose of using a Cause and Effect diagram?
The main purpose of using a Cause and Effect diagram is to facilitate analysis and problem-solving by visually representing the various factors contributing to a particular outcome or issue. It encourages a holistic perspective, allowing stakeholders to explore multiple contributing factors across different dimensions such as people, processes, materials, and equipment. By visually mapping out these relationships, the Cause and Effect diagram helps uncover hidden connections, prioritize potential causes, and guide further investigation. Ultimately, the main purpose of using a Cause-and-Effect diagram is to provide a structured framework for problem analysis, enabling individuals and teams to address underlying causes and implement targeted solutions for improved outcomes.
The steps to characterize Cause and Effect in Six Sigma on a Fishbone diagram are-
- Define your problem.
- Brainstorm with the team on possible causes for the matter.
- Use the 6 Ms while doing so:
- Man – people performing the method or involved,
- Machine – tools and equipment used within the method,
- Method – procedures followed,
- Material – Inputs required within the method,
- Measurement – data on input or product stipulation, and
- Mother nature – environment within which men and machines operate.
- Categorize all the causes as per the 6Ms, which is sort of a Fishbone, hence given the name.
- Prioritize basis data and team view. Within the above diagram, the team believes the highlighted causes are the most important contributory factors.
- Brainstorm solutions for the prioritized causes and implement. The Fishbone or Cause-and-Effect Diagram is an impressive tool, it represents all possible causes and prompts the team to think from a 6M attitude. There are other variations to the 6M. Some manufacturing industries use 4M (Man, Machine, Material, Method), while some service industries use 8P (Physical Evidence, People, Place, Service, Price, Promotion, Process, Productivity and Quality).

Looking of relationships
Most people have had the experience of “solving” a problem over and over meaning the actions taken really did not get to the root of the problem. Use of diagrams like the ones shown below can help you make your solutions more effective the first time around by ensuring that you uncover deep causes of a problem.
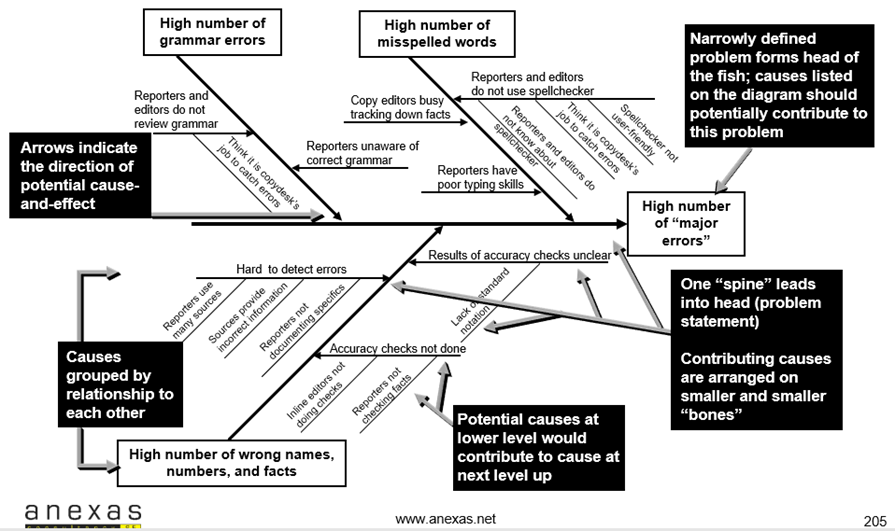
- Graphic displays can help you structure possible causes to find relationships that will shed new light on your problem.
- Cause-and-effect diagrams graphically display potential causes of a problem.
- The layout shows cause-and-effect relationships between the potential causes.
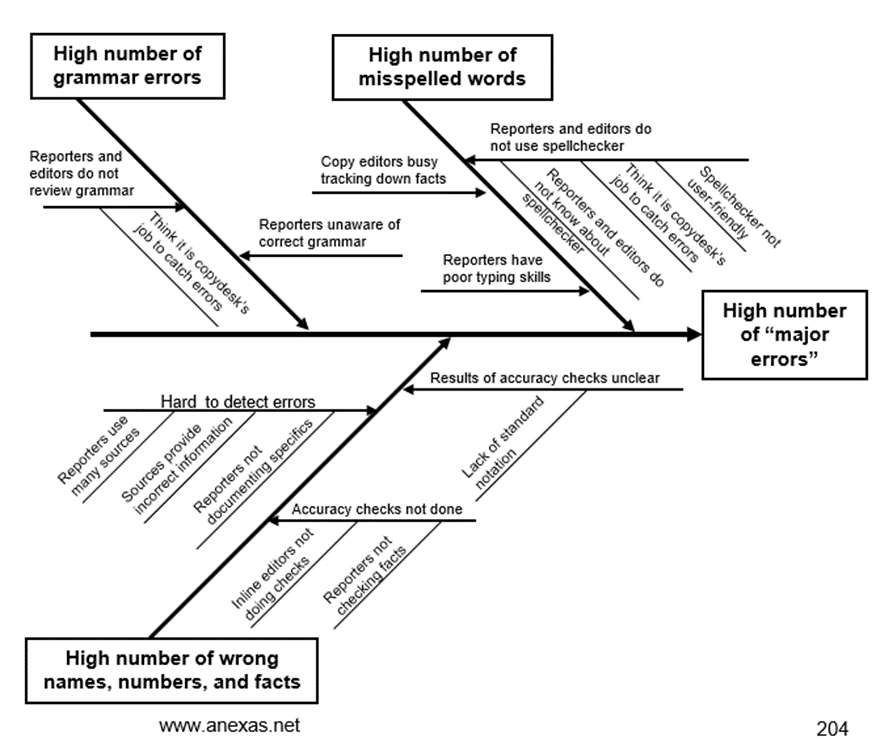
In the image, the Cause and Effect Diagram in Lean Six Sigma example is shown where the heavy lines lead from the main causes (in the narrow boxes) to the “spine,” and then to the “head,” or problem statement. These are the three main causes that the team identified for their problem. Then they asked what might cause each of those causes.
For instance, the fact that reporters and editors do not review grammar might be a cause of the high number of grammar errors in the newspaper. These second-level causes are written on the horizontal lines.
Finally, the team went down one more level and asked what things might cause the second-level causes. In the case of grammar errors, people thinking that it is the copy desk’s job to catch errors might be a cause of reporters and editors not reviewing grammar.
Ground rules for Brainstorming
Brainstorming is an important method of generating lots of ideas quickly. These are following rules to be followed during brainstorming
- Equal opportunity to everyone who participates.
- Capture all the ideas (Document).
- Leave your designation and ego along with your shoes outside the meeting room.
- Non-threatening environment to be created.
- Ensure there are no disturbances.
- Focus on the topic (Create parking lot).
- Fantasise freely (Do not break your thoughts).
- Watch your time.
- Defer evaluation (Do not discuss ideas).
- Generate Quantity, do not worry about Quality.
Example of Cause-and-Effect Diagram 1
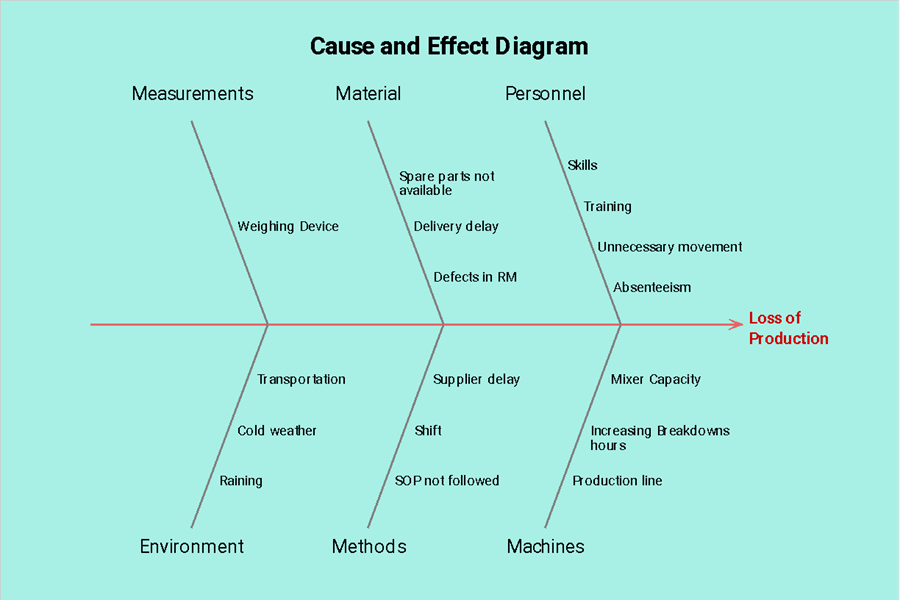
- In the image shown above, The team brainstormed about the possible causes for Loss of production quantity in their production department.
- Cross functional department experts and subject matter experts and process owners are joined together as a team to find the potential causes for loss of production.
- It is a visual representation of the factors that might contribute to an observed effect or phenomenon that is being examined.
- The interrelationships among the possible causal factors are clearly shown. For example, Absenteeism and Shift are possible causes for Production Loss.
Example of Cause-and-Effect Diagram 2
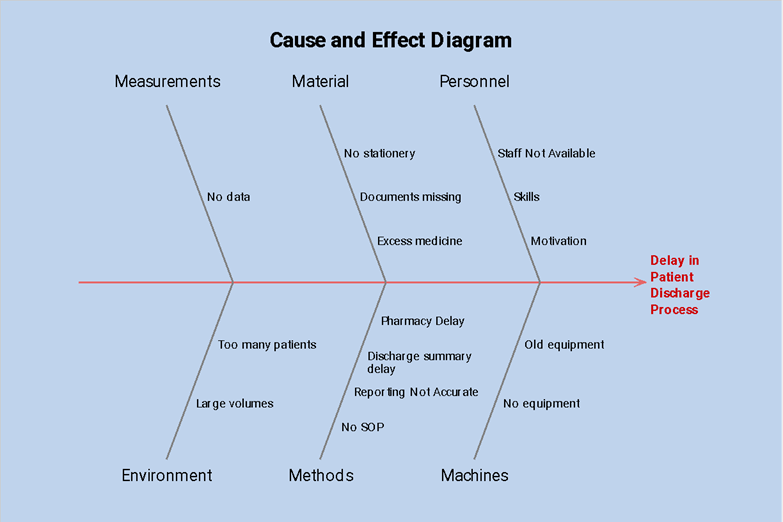
- In the image shown above, The team brainstormed about the possible causes for delay in patient discharge process in their hospital.
- Cross functional department experts and subject matter experts and process owners are joined together as a team to find the potential causes for delay in patient discharge process.
- Pharmacy Delay and Discharge summary delay the reasons are responsible for Delay in patient discharge process.
Example of Cause-and-Effect Diagram 3
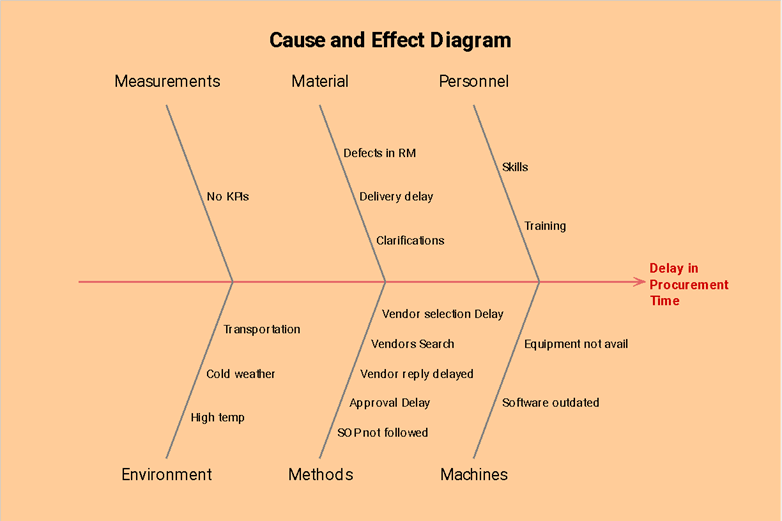
- In the image shown above, The team brainstormed about the possible causes for delay in procurement time in their purchase process. These are given in the above.
- Cross functional department experts and subject matter experts and process owners are joined together as a team to find the potential causes for delay in procurement time.
- Approval delay and vendor selection delay are potential causes for delay in procurement time.
Please answer simple questions given below then compare your answers
Cause and Effect Diagram – Example exercise 1
Cause and Effect or ISHIKAWA Diagrams are also known as ______?
- fishbone diagrams
- PDCA
- tree diagrams
- storyboarding
Cause and Effect Diagram – Example exercise 2
A benefit of Cause-and-effect Diagrams is?
- facilitates root cause analysis
- sensitising people to all the possibilities of defects
- provides a visual of the problem being studied
- all of the above
Cause and Effect Diagram – Example exercise 3
In order for a problem to be solved correctly, which of the following must occur first?
- The problem must be defined
- Relevant data must be gathered
- The measurement system must be validated
- The process must be mapped
Answers for skills building exercises
- Answer for the first sample exercise is : 1
- Answer for the second sample exercise is : 4
- Answer for the third sample exercise is : 1
Conclusion
Usually, people who are working on improvement efforts jump to conclusions without studying the causes. They target one possible cause while ignoring others and take actions aiming at surface symptoms. Cause-and-Effect Diagram avoids this issue. Cause-and-Effect Diagram has been in use for many years in the manufacturing industry. Below are some of the benefits we can get from conducting a Cause-and-effect diagram.
- Providing a structure to understand the relationships among many possible causes of a problem.
- Giving people a framework for planning what data to collect.
- Serving as a visual display of causes that have been studied.
- Helping team members communicate within the team and with the rest of the organisation.
Remember, these examples are just brainstormed based on the team’s understanding of the situation. These are the ideas; possible causes but not verified causes.
Also Read: Lean Six Sigma Green Belt Certification Measure Of Variation