X-Bar and R control charts are used when we are interested in plotting the continuous data on control charts. They are used with processes that have subgroup sample sizes larger than 2. They are standardised charts for variable data and help determine if a particular process is predictable and stable. These are used to monitor the effects of process improvement theories. X-bar and R control charts can be a little difficult to understand, but if understood correctly, can do wonders in improving processes.
Given below are some tips to understand X-bar and R control charts. Read them carefully to understand the topic in depth.
X-Bar and R-Charts are typically used when the subgroup size lies between 2 and 10. These control charts can be used if you need to assess system stability. If the collected data is in subgroups larger than one but less than 11, in invariable form, and the time order of the subgroups is preserved then an X-bar and R control charts can be used.
This is one of the most important topics in Six Sigma black belt certification. This article will cover everything about X-bar and R control charts so that you can get a high score in your Lean Six Sigma Black belt certification exam.
X-bar and R control charts – How to solve & tips
There are a total of 6 tips to complete this topic correctly. These tips are made by industry experts and will help you learn every concept in X-bar and R control charts.
- Control charts like the X-Bar and R-Chart excel are often used in business applications like manufacturing to measure equipment part sizes. It is used in service industries to evaluate customer support call handle times, and in healthcare for measuring blood pressure over time.
- The X-bar chart is used to monitor the mean of a process where measurements are performed in subgroups on a continuous data flow. A Chart generally consists of four lines:
- UCL – Upper Control Limit
- LCL – Lower Control Limit
- X-Bar – sample mean
- X-double bar – grand mean (mean of sample means)
- Upper and lower control limits are calculated from the data set. Almost all of the data points on the chart interpretation fall within these limits as long as the process remains in control. Data points indicate how the average or mean changes over time. It is used to monitor the process mean when calculating subgroups at regular intervals from a process.
- The R-chart is used to monitor the variation of a process performed in subgroups on a continuous data flow. It is usually plotted together with the X-bar chart because it is essential to correctly interpret the X-bar chart. If the R chart is out of control, then the control limits of the X-bar chart might be wrong.
- This Indicates how the range of the subgroups changes over time. The R-chart is used to monitor process variability like range. When measuring subgroups less than ten at regular intervals in a process, an R control chart can be used. Each point on a chart represents the subgroup range value. The range statistic expected value is the centre line for each subgroup. The centre line differs when subgroup sizes aren’t equal.
- Some notes to keep in mind while creating an x-bar R chart are:
- The data must be continuous
- The sample size (sub-group) must be at least two and should not be more than 10-12.
- The sample size cannot vary
- The data should be collected in a random and consecutive manner
- For the first chart on a process, collect at least 20-25 sample groups to ensure that an adequate measure of process variation has been taken
- To correctly interpret the X Bar R chart, always examine the R chart first. The X bar chart control limits are derived from the R bar (average range) values. If the values are out of control in the R chart that means that the X bar chart control limits are not accurate. If the points are out of control in the R chart, then stop the process. Identify the special cause and address the issue. Remove those subgroups from the calculations.
- Once the R bar chart is in control, you can review the X bar formula chart and interpret the points against the control limits. All the points need to be interpreted against the control limits but not specification limits. Specification limits are provided by customers or management whereas control limits are derived from the average and range values of the subgroups. If any point is out of control in X bar chart. Identify the special cause and address the issue.
- These charts are easy to read, understand, analyse and optimise the process. The charts succeed in the separation of variables in averages to that of the variations in standard deviation. Almost anyone can analyse the process improvement result using the chart and formulate statistical calculations.
- The Charts are widely recognized for being a foundation base for many other complex charts. These charts separate variation in averages from variation in standard deviation.
- A few drawbacks of using control charts are that one must use separate charts for each characteristic analysis. The charts cannot present with accuracy the details beyond process variables with greater than 9 sample sizes. These charts can confuse tolerance limits and control limits.
- These charts can be used only for one individual characteristic at (dimension such as length or width or taste or any quality parameters) a time. They are costly and time-consuming.
Steps to plot X- Bar and R control charts and X bar and R chart solved examples
- Step – I: Calculate Average (x-bar) and Range (R) for each sample. A good number of samples of items manufactured are collected randomly at different intervals of time and their quality characteristics (e.g. diameter, thickness, length, weight etc.) are measured. For Example: If a sample contains five items (i.e. n = 5), whose dimensions are X1, X2, X3, X4 and X5 then, X = X1 + X2 + X3 + X4 + X5/5 and R = (Largest value − Smallest value)
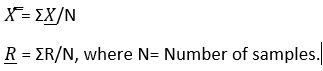
- Step – II: Calculate grand average X and average range R. It is obtained by dividing the sum of all X values and ‘R’ values by number of samples, i.e. subgroups.
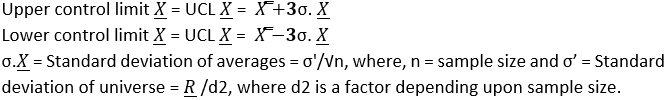
- Step – III: Calculate 3σ limits for X chart. The control limits are given by,
- Step − IV: Calculate 3σ limits for R chart
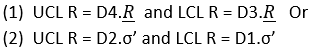
Note: Values of various factors such as d2, D4, D3, D2 and D1 are based on the normal distribution and can be obtained from standard tables for a particular sample size.
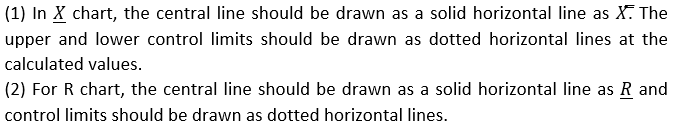
- Step – V: Plot X and R chart
X bar and R chart solved examples
Lean Six Sigma Green Belt Certification X-Bar and R Control Chart example 1
__ are used for subgroup sizes greater than 1 (and typically less than 9 or 10)?
Lean Six Sigma Green Belt Certification X-Bar and R Control Chart example 2
X-bar chart represents
Lean Six Sigma Green Belt Certification X-Bar and R Control Chart example 3
R chart represents
Lean Six Sigma Green Belt Certification X-Bar and R Control Chart example 4
If R chart is within control limits?
Answers for skills building exercises
Answer for the first sample exercise is: X-Bar and R-Charts are normally used when the subgroup size lies between 2 to 10
Answer for the second sample exercise is : The X-bar chart shows how the mean or average changes over a period of time
Answer for the third sample exercise is : R chart shows how the range of the subgroups changes over a period of time
Answer for the third sample exercise is : R charts are used to display the variation of a process based on sample data taken from the process at given period of time groups changes over period of time
Also read: Lean Six Sigma Green Belt Certification Process Sigma and DPMO