Process sigma (also referred to as sigma level) is a measure of process capability: the higher the process sigma, the more capable the process is. Defects per million opportunities (DPMO), are often used in connection with process sigma. It is of particular interest for discrete variables. The preferred standard method of determining DPMO is to use actual process data, count the defect opportunities outside the specification limits and then scale that number up to the equivalent of a million opportunities.
DPMO is important because it can help give you a good estimation of how efficient your production process is. Efficiency in business can be key to a company’s growth and profitability. Based on what your DPMO is, you can adjust your procedures, resources and personnel to make improvements. The adjustments you make can help you get the most of your resources and potentially minimize costs, which can boost your productivity and competitiveness. Also as a part of Black belt certification, it is one of the important topics to be focused on. This article will guide you on how to calculate the DPMO and measure the Sigma level from it.

Enquire here
How to calculate DPMO and tips
To understand DPMO, it’s important to understand the terms involved such as defects, defectives and opportunities. A defect is a flaw or discrepancy in a process or object. There can be multiple flaws or defects in an object. For example, an invoice may have a defect or error in the address line, invoiced amount, discount, or delivery date. Each one is an opportunity to make a mistake on the invoice that you send to your customer. Each defect can cause disruption and upset your customer.
Opportunities refer to the number of issues or flaws that can occur. A defect opportunity is a potential defect and not an actual, observed defect, and it can depend on how complex a product or unit is, which means the more complex the unit, the more opportunities for defects to occur.
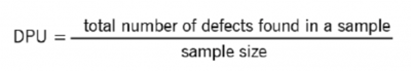
We can then define a defective as an object that has one or more defects that may make the object unacceptable. In our example, your invoice can have up to four different types of opportunities (for defects), which could then define your invoice as a defective invoice. To Calculate the DPU (Defects Per Unit), this will give you an average estimate of defects per unit, and the ratio of the total number of defects found in the sample to that of the sample size.
Respectively to find the DPMO (Defects Per Million Opportunities),
- Determine the total number of units in your sample size.
- Calculate the number of defect opportunities per unit in your sample.
- Determine the total number of defects in your sample.
- Multiply the number of units in your sample size by the number of defect opportunities in the sample. This will give us the total number of opportunities in a batch selected.
- Divide the total number of defects in your sample by the number you got from step 4.
- Multiply your number from step 5 by 1,000,000 to get your DPMO

While calculating DPMO the most recommended practices to be on track are
- Be realistic
- Use appropriate sample size [Insert link of Sampling types and procedure]
- Use clear definitions
DPMO Examples
Let’s practice some examples to get the clarity of the topic how a company might use and calculate the DPMO and measure the sigma level from the data. Try to solve the cases on your own which will benefit in preparing for certification and the process of calculation.
- A company produces millions of brake pads for a variety of vehicles each year. Recently, customers began reporting to their mechanics that their new brakes feel softer than usual, and mechanics informed the company that their inspection of the pads noted unusual dents. The company began a process improvement audit to discover the extent of the issue by using a sample of 1,000 brake pads. Their investigation revealed there were six opportunities for the dents to occur throughout the production process because of different machines being used. The audit turned up 450 pads with abnormal dents in the sample among the company’s manufacturing plants.
- Jackie’s T’s, a custom T-shirt company, has discovered some problems with a few of their recent orders. For every order, the company estimates there are three opportunities for defects to occur: a typo in the logo, incorrect colouration or general damage. They pull aside a sample of 200 T-shirts to inspect and find 26 total defects. The company typically ships a few thousand shirts a quarter.
- At a customer service centre, the team considers each order a transaction. For each successful transaction team asks and needs to fill 4 fields. The operations team was not able to do the tasks required due to insufficient or misalignment in transactions entry. Service centre plans for process improvement, from a sample of 1000 transactions, 20 orders had 2 defects each and 20 miscellaneous defects apart from these orders.
Now, calculate the DPMO, Analyse the cases thoroughly and find the sigma level of the process. Answers to the respective cases are given below. You can practice the mock test question on this topic from
Importance of Process sigma over Quality Percentage
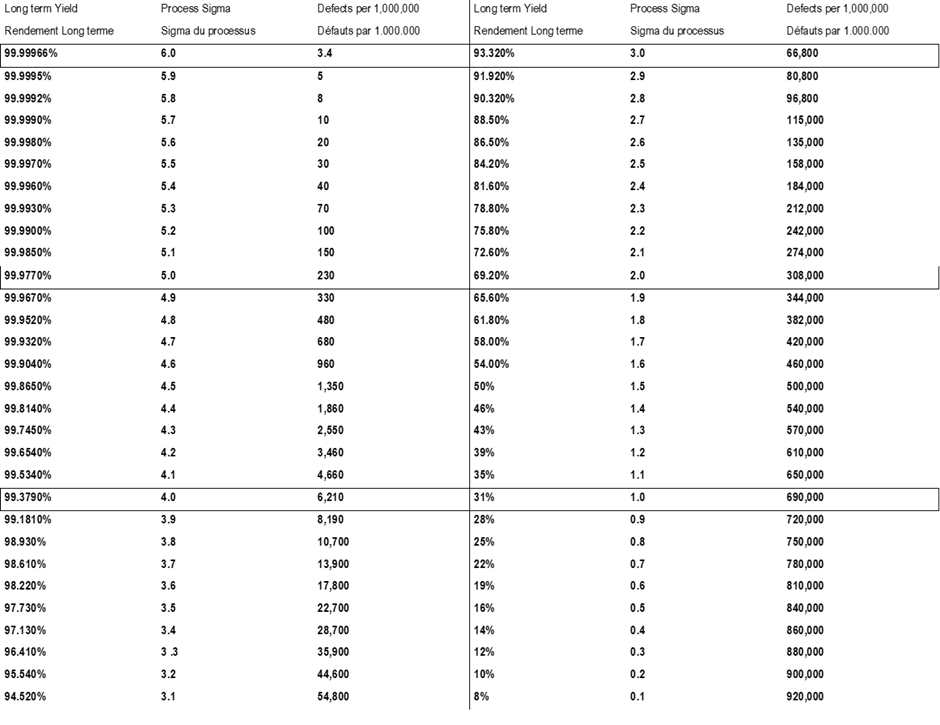
Process sigma is a more sensitive indicator than a quality percentage. As shown in the table below, percentage measures are less sensitive indicators as you get better and better. This is especially true for high-volume processes. It’s easy to get an intuitive feeling for the difference between 93% and 99% quality—but 99.977% and 99.9997% don’t sound that different. Yet both comparisons reflect a difference of one sigma.
Similarly, 99% quality sounds pretty good—but knowing there are 6,210 defects per million opportunities means being aware that there is obviously significant room for improvement.
| Quality Percent | DPMO | Sigma Level |
| 93 | 66,807 | 3.0 |
| 98 | 22,750 | 3.5 |
| 99 | 6,210 | 4.0 |
| 99.87 | 1,350 | 4.5 |
| 99.977 | 233 | 5.0 |
| 99.9997 | 3.4 | 6.0 |
Sigma Level conversion Table from DPMO:
Answers for skills building exercises
Answer for the first sample exercise is : The company chose the sample size of 1000 units for the process improvement. There are 6 opportunities for defect per unit. So, 1000 x 6 = 6000 opportunities for this sample. The audit found 450 defects in total. So, 450/6000 = 0.075. Hence, Defects per million opportunities will be 75,000. From the sigma level conversion chart we can measure that this process of the company falls at the 2.95 sigma level and has enough scope for improvement.
Answer for the second sample exercise is : The company choose a sample size of 200 units for the process improvement. There are 3 opportunities for defect per unit. There were multiple defects but the considered 3 are critical to the quality and customer satisfaction and are selected by Pareto analysis. So, 200 x 3 = 600 opportunities of defect for this sample. After inspection 26 defects in total were found. So, 26/600 = 0.043. Hence, Defects per million opportunities will be 43,333. From the sigma level conversion chart [add chart link] we can measure that this process of the company falls at the 3.18 sigma level and have enough scope for improvement.
Answer for the second sample exercise is : The company choose the sample size of 1000 units i.e. for transactions. Each transaction has 4 fields to fill i.e. 4 opportunities per order. So, 4 x 1000 = 4000 opportunities here. For the defects, 20 orders having 2 defects each will sum up to 40 defects and 20 defects miscellaneous summing to 60 defects in total for the whole sample. So, 60/4000 = 0.015. Hence, Defects per million opportunities will be 15,000. From the sigma level conversion chart we can measure that this process of the company falls at the 3.65 sigma level and have enough scope for improvement.
Once your process DPMO and Sigma level are measured, the project charter is defined thoroughly and we can say the data measured in the Measure phase can be interpreted with this and can decide, how much scope does this process have for improvement? Also, it will help to choose which door to opt-in analyse phase i.e. data door or the process door.