Let’s say the project charter is defined. Now in analyze phase while going through the data door need to identify the potential causes from brainstorming sessions held by various techniques of it. Now we have enough ideas, opinions, causes, information, problems and the list continues. Here is where an affinity diagram will help you organize them. Also as a part of Black belt certification, it is one of the important topics to be focused on. This article will guide you on how to make the affinity diagram ineffective way and its possible advantages.
An affinity diagram shows the relationships between information, opinions, problems, solutions, and issues by placing them in related groups. It allows a broad range of ideas to be organized so they can be more effectively analyzed. Affinity diagrams were invented by Jiro Kawakita in the 1960s, who called this diagram the K-J Method. They help prioritize actions and improve group decision-making.

When to use Affinity Diagram in Six Sigma?
The Affinity Diagram is a powerful tool in Lean Six Sigma methodology. It is particularly useful when there is a need to organize and categorize a large amount of unstructured information or diverse ideas. By using the Affinity Diagram, teams can identify patterns, themes, and relationships, enabling them to make informed decisions. When conducting an affinity diagram root cause analysis, the affinity diagram is valuable in organizing and categorizing information to identify underlying causes. This tool also enhances collaboration, fosters inclusive discussions, and promotes data-driven decision-making. When implementing Six Sigma, understanding when to use an affinity diagram is crucial. Overall, the Affinity Diagram is instrumental in streamlining ideas and improving problem-solving processes in Six Sigma.
In the Lean Six Sigma methodology, various tools facilitate efficient problem-solving and decision-making processes. Among these tools, the tree diagram, matrix diagram and XY diagram hold significance. The tree diagram in Lean Six Sigma helps analyze and visualize the hierarchical relationships among factors contributing to a problem or objective. The matrix diagram in Lean Six Sigma aids in evaluating the strength and nature of relationships between different elements. Lastly, the XY diagram in Lean Six Sigma, also known as the scatter plot, allows for the exploration of relationships between two variables. Together, these tools play a vital role in enhancing problem-solving and analysis within the Lean Six Sigma framework.
Best Practic
Best Practice to Make Affinity Diagram
- Set the theme: It works best when the issue is stated broadly. Once everyone agrees on the question, place it on top of a flip chart page or blackboard to make it visible to team
- Generate and record verbatim: For design and development, these verbatim come from Voice of the Customer data. Write the Verbatim on small cards or Post-it notes to facilitate sorting and organizing. Be concise; no more than five to seven words per card. Whenever possible, the statement should have a noun and a verb to avoid ambiguity. Print clearly, as large as the card will allow
- Display the completed cards: Mix the cards or self-stick notes and spread them out randomly. If using cards, use a large table to display them; if using self-stick notes, use a flip chart or a bare wall to display them. Allow enough space in front of the work area to enable all team members to easily see and move the cards
- Assemble the right team members: The team must have the necessary knowledge to uncover the various dimensions of the issue. It helps if the members are accustomed to working together. Include people with valuable input even if they have not been involved with the subject in the past. The team should consist of five or six members
- Arrange cards into related groups: This should be done by each member simultaneously and in silence. Find two cards that are in some way related and place them side by side. Look for other cards that are related to each other or the selected cards. Repeat the process until all the cards are placed in six to 10 groupings. Cards that do not fit a group are loners and each may constitute a group
- Create header cards: Capture the central idea that ties all the cards in a group together and write this idea on a header card. Place the header at the top of each group. Gather each grouping together, with its header card at the top of column
- Draw the finished affinity diagram: Draw lines around each grouping to clearly connect all the items with the header card. Place related groupings near each other and connect them with lines. If it is valid, create a “super header” that sums up how the groups relate. Place the super header above the groups and bound them with lines
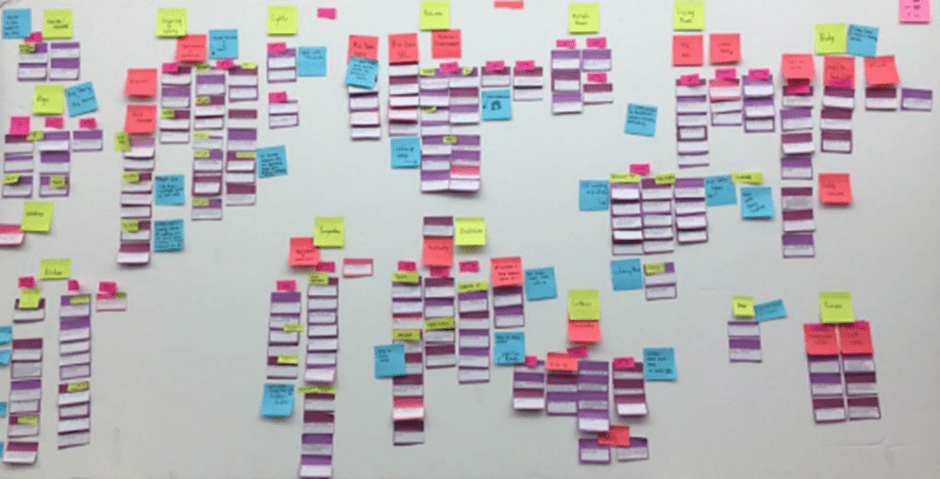
Affinity Diagrams can help you go from complete chaos and no overview of your information to creating groups of information, which you have named and organized into hierarchies that make sense. You can use the template or Saturate with cards/post-its. The wall would look somewhat then
Examples
We learned the detailed process of making the affinity diagram from a bucket full of ideas, solutions, opinions, etc. In this section try your hands on the given cases to practice them and perform better in your black belt certification exam
Problem with Prescription Delivery: A West Coast hospital system was wrestling with a problem of prescriptions either being delivered to patients late or so slowly that discharge orders were delayed. Those close to the process were blaming each other (“It’s the pharmacy’s fault,” “Doctors don’t send scripts down early enough,” “Prescriptions pile up at nurses’ stations,” etc.). It was time to call in some team skills and the first of these was the affinity exercise. The brainstorming/Crawford slip approach yielded the following observations:
- Pharmacist can’t read the order
- Procedure is unclear
- Prescription requests sent by phone
- Quantity is often wrong
- Pharmacists aren’t familiar with medications
- New staff in pharmacy
- Uneven workload
- Late mornings are extremely busy
- Changes in medication orders
- Information isn’t correct
- Patient’s name not clear
- Inventory not recorded properly
- Labels can’t be read
- Lack of training
- Delivery schedules are unpredictable
- Orders aren’t signed properly
- Shortages of containers for certain meds
- Blanks on the form are too small
- Medication stop orders aren’t clear
- Unevenness in staff schedules
- Shift changes delay delivery
Now, organize the information brainstormed by related topics i.e. have an affinity with one another. You can compare the answer in the later section
Values That Represent a School:
Affinity diagrams are useful in organizing disparate information of any kind. Students at The Miami Valley School in Dayton, Ohio, were asked to identify values that represented their experience at the school by listing qualities that they saw in the ideal student. Generating hundreds of ideas meant that boiling the qualities down into core values that represented the school was a Herculean task. Here in this case too with an affinity diagram. we shall organize this list. Among the very long list were the following traits:
- Perseverance
- Happiness
- Integrity
- Intelligence
- Broad interests
- Service
- Engagement
- Tenacity
- Stick-to-it-iveness
- Respect for others
- Tolerance
- Comfort with ambiguity
- Politeness
- Courtesy
- Interest in others
- Positive relationships
- Kindness
- Helpfulness
- Values
- Belief in self
- Respect for teachers
- Diversity
- Ability to get along
- Broad range of interests
- Helpful
- Unselfish
- Knowledge of self
- Responsiveness
- Love of life
- Honesty
- Diligence
- Hard-working
Similar to the last case, Make the header and group the ideas into their affinity. Some additional tips while solving it in the group make sure you remember these things,
Silent process: Move cards without talking. This encourages unconventional thinking and discourages semantic battles.
Gut reaction: React—do not contemplate. If you do not like where a card is placed, move it. It will eventually settle into consensus. If a card keeps shifting back and forth, make a duplicate and put it in both groups.
Avoid pigeonholing: Allow groups to “emerge from the chaos” of the cards. Avoid sorting cards into safe, known categories, as this would force-fit everything into existing logic and prevent breakthroughs from occurring.
Group size: There can be a “group” of one card, but consider whether a small group can be combined with another. If a group seems too large, consider whether it might be broken down into more precise groups.
For case 1, it would look like:-
Orders
- Pharmacist can’t read the order
- Labels can’t be read
- Blanks on the form are too small
- Patient’s name not clear
- Prescription requests sent by phone
Staffing Issues
- Pharmacists aren’t familiar with medications – New staff in pharmacy
- Workload uneven
- Lack of training
- Unevenness in staff schedules
- Shift changes delay delivery
Environment and Materials
- Late mornings are extremely busy
- Shortages of containers for certain meds
- Inventory records missing
- Delivery schedules unpredictable
Accuracy
- Medication stop orders aren’t clear
- Procedure is unclear
- Quantity is often wrong
- Changes in medication orders
- Orders aren’t signed properly
- Information records missing
For case 2, in a similar way, naming the appropriate headers
Integrity
- Respect for others – Honesty
- Belief in self
- Tolerance
- Responsiveness
Grit
- Diligence
- Perseverance
- Tenacity
- Stick-to-it-iveness
- Hard-working
Celebration
- Happiness
- Intelligence
- Broad interests – Service
- Positive
- relationships
- Values
- Knowledge of self – Love of life
- Diversity
- Engagement
Kindness
- Politeness
- Courtesy
- Helpful
- Unselfish
- Interest in others – Helpfulness
- Respect for teachers
- Ability to get along
Lean Six Sigma Green Belt Certification Affinity Diagram example 1
_ analysis can help you better understand your customers’ comments
Lean Six Sigma Green Belt Certification Affinity Diagram example 2
What is an affinity diagram?
Lean Six Sigma Green Belt Certification Affinity Diagram example 3
Which of the following is not a use of affinity diagram?
Lean Six Sigma Green Belt Certification Affinity Diagram example 4
Affinity diagrams were invented by __
Answers for skills building exercises
Answer for the first sample exercise is : Verbatim analysis can help you better understand your customers’ comments, while offering a new perspective on feedback provided via open questions in your surveys.
Answer for the second sample exercise is : Affinity diagrams help to unify large amounts of data by finding relationships between concepts or ideas. They allow you to organize facts, opinions, and issues into taxonomies in order to help diagnose complex problems and identify common issues.
Answer for the third sample exercise is : Affinity diagrams help to unify large amounts of data by finding relationships between concepts or ideas. They allow you to organize facts, opinions, and issues into taxonomies in order to help diagnose complex problems and identify common issues.
Answer for the fourth sample exercise is : It was created in the 1960s by Japanese anthropologist Jiro Kawakita.
Also read: Lean Six Sigma Green Belt Certification Affinity Diagram