Lean Six Sigma Black Belt Certification P and NP charts
Control charts are graphs used to study how processes change over time. The selection of appropriate control charts is very important in control charts mapping. If you don’t use the right control chart you may end up with inaccurate control limits for the data. Hence read this article carefully and go through the exercises given at the end to master the topic of Lean Six Sigma Black Certification P and NP charts.
A control chart always has a central line for average, an upper line for upper control limit, and a lower line for the lower control limit. The control limits are ±3σ from the centerline. In this article, we will cover all the topics in P and NP charts and provide certain tips and tricks to master this concept.
You can also click here to check out some of the important Lean Six Sigma questions

P and NP Charts- How to solve and tips
There are a total of (12) tips to complete P and NP charts accurately. Follow the tips given below and note down the formulae and practice them at least twice to master P and NP charts. Given below are proven and tested tips by industry experts

- There are two types of data. Continuous or Variable and Attribute or Categorical. For variable data, X̅ and R charts are used for measurable quantities such as length, weight, and height. Attribute control charts are used for attribute data. Attribute data is the data that counts the number of defective items or the number of defects per unit. Unlike variable charts, only one chart is plotted for attributes.
- Four types of control charts exist for attribute data. p-chart plots the proportion of defective items, and the np-chart is used to plot the number of defectives. c chart is used to plot the number of defects and the u-chart is used for the average number of defects per unit.
- A p chart is also known as the control chart for proportions. It is generally used to analyze the proportions of non-conforming or defective items in a process. It uses binomial distribution to measure the proportion of defectives or non-confirming units in a sample. In the p-chart, proportions are plotted on the y-axis and the number of samples is plotted on the x-axis.
- The centerline of the p-chart (p̅) is the total number of defectives or non-conforming units divided by the total number of items sampled. p̅= total number of defectives/ total number of items sampled
- p chart is one of the quality control charts and is used to assess trends and patterns in counts of binary events (e.g., pass, fail) over time. p charts are used when the subgroups are not equal in size and compute control limits based on the binomial distribution.
- Assumptions made in the p-chart are,
- The probability of non-conformance is the same for each item
- There should be two events (pass or fail), and they should be mutually exclusive
- Each unit is independent of the other
- The testing procedure should be the same for each lot
- How do you create a p Chart?
- Determine the subgroup size. The subgroup size must be large enough for the p chart; otherwise, control limits may not be accurate when estimated from the data.
- Calculate each subgroups non conformities rate= np/n
- Compute p̅ = total number of defectives / total number of samples =Σnp/Σn
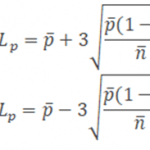
- Calculate the upper control limit (UCL) and low control limit (LCL). If LCL is negative, then consider it 0. Since the sample sizes are unequal, the control limits depend on the sample interval.
- Plot the graph with proportion on the y-axis, lots on the x-axis: Draw the centerline, UCL and LCL.
- Finally, interpret the data to determine whether the process is in control.
- np chart is also known as the control chart for defectives (d-chart). np= total number of defectives/number of lots sampled.
- np is generally used to monitor the number of non-conforming or defective items in the measurement process. It uses binomial distribution to measure the number of defectives or non-confirming units in a sample. The np chart is very similar to the p chart. np charts plot the number of items, while p charts plot the proportion of defective items. In the np-chart, the number of defectives is plotted on the y-axis and the number of samples on the x-axis. The centerline of the np-chart (np̅) is the total number of defectives or non-conforming units divided by the number of lots.
- The np chart is one of the quality control charts and is used to assess trends and patterns in counts of binary events (e.g., pass, fail) over time. np chart requires the sample size of each subgroup to be the same and computes control limits based on the binomial distribution.
- Assumptions made in the np-chart are,
- The probability of non-conformance is the same for each item
- There should be two events (pass or fail), and they are mutually exclusive
- Each unit is independent of the other
- The testing procedure should be the same for each lot
- How do you create an np Chart?
- Determine the subgroup size. The subgroup size must be large enough for the np chart; otherwise, control limits may not be accurate when estimated from the data.
- Count the number of defectives in each sample
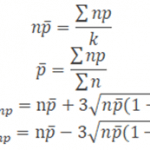
- Compute p̅ = total number of defectives / total number of samples =Σnp/Σn
- Calculate centreline np̅ = total number of defectives/no of lots = Σnp/k
- Calculate the upper control limit (UCL) and low control limit (LCL), If LCL is negative, then consider it as 0.
- Plot the graph with defectives on the y-axis and lots on the x-axis: Draw the centerline, UCL and LCL. Use these limits to monitor the number of defectives or nonconforming going forward.
- Finally, interpret the data to determine whether the process is in control.
Some formulae to keep in mind
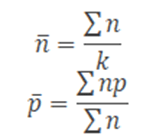
Where
np = number of defectives in the sample
k= number of lots
n= sample size
Lean Six Sigma Black Belt Certification P and NP charts example 1
When we monitor the number of defectives on different size samples. Which of the following control charts would be most appropriate
Lean Six Sigma Black Belt Certification P and NP charts example 2
A very useful attribute control chart for plotting the actual number of defectives found during an inspection (same sample size) is known as the
Lean Six Sigma Black Belt Certification P and NP charts example 3
When we monitor the number of defects on different size samples. Which of the following control charts would be most appropriate
Lean Six Sigma Black Belt Certification P and NP charts example 4
When we monitor the number of defects on constant samples size. Which of the following control charts would be most appropriate
Answers for skills building exercises
Answer for the first sample exercise is : The p-Chart chart can be used if the sample subgroup size varies from sampling interval to sampling interval. In this case, the control chart high and low limits vary from sample interval to sample interval, depending on the number of samples in the associated sample subgroup.
Answer for the second sample exercise is : The np control chart plots the number defective over time, and the subgroup size has to be the same each time.
Answer for the third sample exercise is : The u chart is for the number of defects in a sample. The symbol u is used to represent defects per unit. The u chart is used in cases where the samples are of different size.
Answer for the fourth sample exercise is : A c-chart is an attributes control chart used with data collected in subgroups that are the same size. C-charts show how the process, measured by the number of nonconformities per item or group of items, changes over time.
Also, read some tips to pass the Lean Six Sigma Black Belt Certification U and C charts