Lean Six Sigma Black Belt Certification U and C charts
The control chart is a graph used to study how a process changes over time. A control chart always has a central line for average, an upper line for the upper control limit, and a lower line for the lower control limit. Studying the control charts is very important and is a tricky topic for many professionals. The control limits are ±3σ from the centerline. Selection of appropriate control charts is very important in control chart mapping, else you may end up with inaccurate control limits for the data.
Attribute control charts are used for attribute data. In other words, the data that counts the number of defective items or the number of defects per unit. Four types of control charts exist for attribute data. p chart plots the proportion of defective items, and the np-chart is for the number of defectives. c chart is used for the number of defects and the u-chart is used for the average number of defects per unit. In this article, we will cover all the topics in U and C charts and provide certain tips and tricks to master this concept. You can also click here to check out some of the important Lean Six Sigma questions
You can also click here to check out some of the important Lean Six Sigma questions

U and C Charts- How to solve and tips
There are a total of (10) tips to complete U and C charts accurately. Follow the tips given below and note down the formulae and practice them at least twice to master U and C charts. Given below are proven and tested tips by our industry experts-

- U-chart is also known as the control chart for defects per unit. It is generally used to monitor the countable type of data where the sample size is greater than one. There may be a single type of defect or several different types, but the u-chart tracks the average number of defects per unit and assumes the underlying data, approximate to the Poisson distribution.
- In the u-chart, the number of defects per single unit is plotted on the y-axis and the number of units or lots is plotted on the x-axis. The centerline (u̅) is the total number of defects in a sample divided number of inspected items in a sample.
- u chart is one of the quality control charts to monitor the number of defects per unit. It is also used to monitor process stability over time and the effects before and after process improvements. It is used when the sample size varies, for example- the number of meals, bills delivered each day etc. It computes control limits based on the Poisson distribution.
- Assumptions made in u charts are-
- ○ The probability of defect is the same for each item
- ○ Each unit is independent of the other
- ○ The testing procedure should be the same for each lot
- Steps to create u-Chart-
- ○ Determine the subgroup size. The subgroup size must be large enough for the c chart, else the control limits may not be accurate when estimated from the data.
- ○ Count the number of defects in each inspected unit.
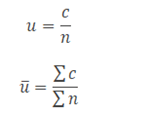
- ○ Calculate the u-value for each lot; u= number of defects in each lot/ lot size.
- ○ Compute centerline u̅; u̅= total number of defects / total number of samples =Σc/Σn.
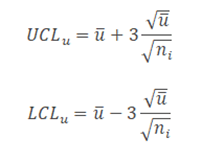
- ○ Calculate the upper control limit (UCL) and low control limit (LCL). If the sample sizes are unequal, the control limits will depend on the sample interval.
- ○ Plot the graph with the number of defects per unit on the y-axis and lots on the x-axis: Draw the centerline, UCL and LCL. Use these limits to monitor the number of defects going forward.
- ○ Interpret the data to determine whether the process is in control.
- c chart is also known as the control chart for defects (counting the number of defects). It is generally used to monitor the number of defects in constant size units. There may be a single type of several types of defects, but the c chart tracks the total number of defects in each unit and assumes the underlying data approximated to the Poisson distribution. The unit may be a single item or a specified section of items, for example, scratches on plated metal, the number of insufficient soldering in a printed circuit board etc.
- c chart takes into account the number of defects in each defective unit or a given sample, while the p-chart analyzes the proportions of non-conforming or defective items in a process. In the c chart, the number of defects is plotted on the y-axis and the number of units on the x-axis. The centerline of the c chart (c̅) is the total number of defects divided by the number of samples.
- c chart is one of the quality control charts used to track the number of defects in a product of constant size, while the u-chart is used for varying sizes. c-chart is used to determine if the process is stable and predictable and to monitor the effects of before and after process improvements. c chart is especially used when there are high opportunities for defects in the subgroup, but the actual number of defects is less. c chart requires each subgroup’s sample size to be the same and computes the control limits based on the Poisson distribution.
- Assumptions made in the c-chart are-
- ○ The probability of a defect is the same for each item.
- ○ Each unit is independent of the other.
- ○ The testing procedure should be the same for each lot.
- Steps to create a c chart-
- ○ Determine the subgroup size. The subgroup size must be large enough for the c chart, else the control limits may not be accurate when estimated from the data.
- ○ Count the number of defects in each sample.
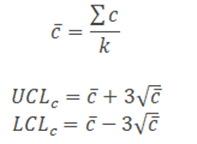
- ○ Compute centerline c̅ = total number of defects / number of samples =Σc/k.
- ○ Calculate the upper control limit (UCL) and low control limit (LCL). If LCL is negative, then consider it as 0.
- ○ Plot the graph with the number of defects on the y-axis and lots on the x-axis. Draw the centerline, UCL and LCL. Use these limits to monitor the number of defects going forward.
- ○ Interpret the data to determine whether the process is in control.
Some formulae to keep in mind
Where
c = number of defects
K= number of lots
n= sample size
Where
c = number of defects
k= number of samples
Lean Six Sigma Black Belt Certification U and C charts example 1
U chart is performed to find the variation of _______
Answers for skills building exercises
Answer for the first sample exercise is : Defects as a Unit chart is used to identify the variation of defects present in the process when we have sample size being not constant