Simple Linear Regression is used to estimate the relationship between two quantitative variables. You can use Simple Linear Regression when you want to know how strong the relationship is between two continuous variables (e.g., the relationship between calories taken and weight gained). The output value (Y) of the dependent variable at a certain input value (x) of the independent variable (e.g., the amount of weight gained (Y) by the person at a certain level of calories consumed(x)).
his article will cover all the tips and tricks which will help you successfully understand the Simple Linear Regression for your process and clear the Lean six sigma certification exam
Anexas Lean Six Sigma Black Belt course trains you thoroughly in Simple Regression while allowing you to practice and master it through project practices during the course. You can go through our Lean Six Sigma Black Belt course details, which will help you in making a decision
What are the Simple Linear Regression assumptions?
Simple Linear Regression is an important root cause analysis method that we use in Lean Six Sigma projects. As data follows a normal distribution, it is a parametric test that categorizes certain assumptions about the data. These assumptions are
- The similarity of variance (homogeneity): the size of the error in our prediction does not change differences across the values of the independent variable.
- The individuality of observations: the observations in the dataset were collected using statistically valid sampling approaches, and there are no hidden associations among observations.
- Normality: The dataset follows a normal distribution.
- The association between the independent and dependent variables is linear: the line of best fit through the data points is a straight line rather than a curve.
- If the dataset does not meet the assumptions of homogeneity or normality, you may use a nonparametric test instead, such as the Spearman rank test.
Method of least squares in Simple Regression
In Simple Linear Regression, the least square method is the procedure of finding the best-fitting curve or line of best fit for a set of data points by reducing the sum of the squares of the residual part (offsets) of the points from the curve. During the process of determining the relationship between two variables, the trend of the results is estimated quantitatively. This method is termed Regression Analysis. The method of curve fitting is a procedure for regression analysis. This method of providing fitting equations that approximate the curves to given raw data is the least squares. It is obvious that the fitting of curves for a particular data set is not always exclusive. Thus, it is necessary to determine a curve having a minimal deviation from all the measured data points. This is known as the best-fitting curve and is found by using the least-squares method.
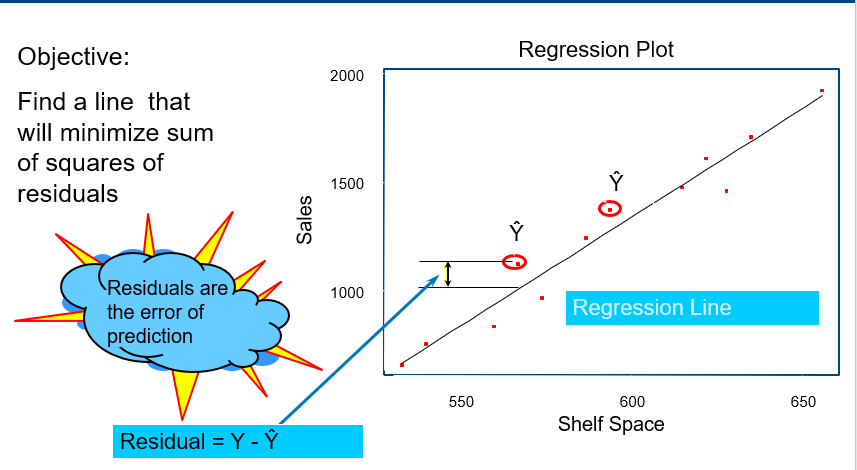
Figure 1:Showing the residuals in the regression plot which is the best fit for the data shelf space vs.
What is the relationship between correlation and regression?
Correlation tells us how much linear association exists between two variables. The regression process creates a line that best resembles the relationship between process input and output and provides an equation describing the nature of the relationship. Regression provides an equation describing the nature of the relationship.
Different types of mathematical models
The regression process can fit several different types of lines since the linear relationship won’t be applicable to all situations. The alternatives are
- Linear: It is a simple, common relationship that has the simplest mathematical model: Y= m(x) + c. where m and c are constants.
- Quadratic: A more complex mathematical model that includes X2 terms. This can be used to model process relationships that rise and then fall again.
- Cubic: A rarer situation where the process relationship rises, falls, then rises again (or vice versa).
Steps in Hypothesis tests
State the null hypothesis
- Null Hypothesis is:
- Y is independent of X (Regression) [Continuous –Continuous]
- State the alternative hypothesis (Ha)
- Y is dependent on X (Regression)
- Choose the alpha value (α = .05). Also known as the level of significance.
- Confidence Level = 1-α
- Collect data
- Choose the appropriate hypothesis test
- Get p value
- If p is < 0.05, Reject Ho
- If p is > 0.05, Accept Ho
- Remember:
- If p is low Ho must go
- If p is high, Ho must fly
List of Regression Terminologies
- Response Variable
- This is the uncontrolled variable—also known as the dependent variable, output variable, or Y variable.
- Regressor Variable
- Response depends on these variables-also known as independent variables, input variables, or X variables.
- Noise Variable
- Input variables (X) that are not controlled in the experiment
- Regression Equation
- An equation that describes the relationship between independent variables and dependent variables
- Residuals
- The difference between predicted response values and observed response values
- Determination of a Model
- Explore the existence of relationships
- Prediction
- Describe the nature of the relationship using an equation and use the equation for prediction.
- Estimation
- To assess the accuracy of prediction achieved by the regression equation
- The Determination of KPIV
- Screen variables and determine which variable has the biggest impact on the response variable.
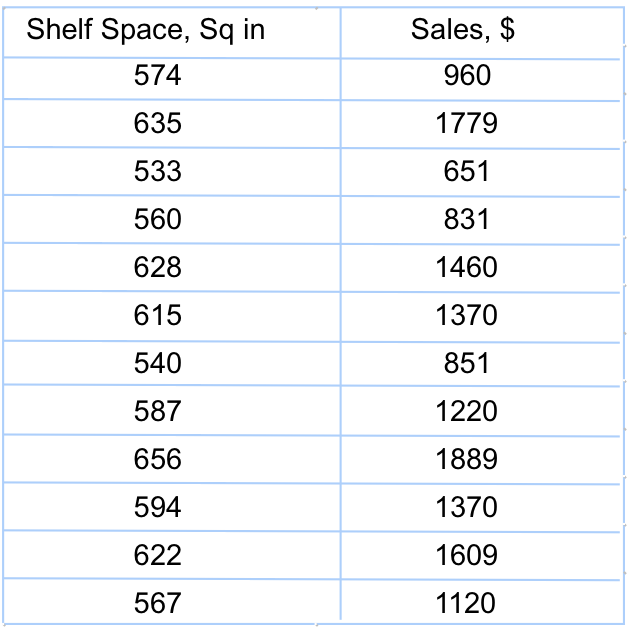
Business process example- Cereal Sales:
A market research analyst for a certain brand of cereal is interested in predicting the sales generated from information on shelf space used to display the cereal. As a result, she conducted a study and collected data from 12 different stores selling this brand of cereal.
How will we display the relationship between the two variables?
- Histogram: Tool Bar Menu>stat>Basic statistics>Graphical summary
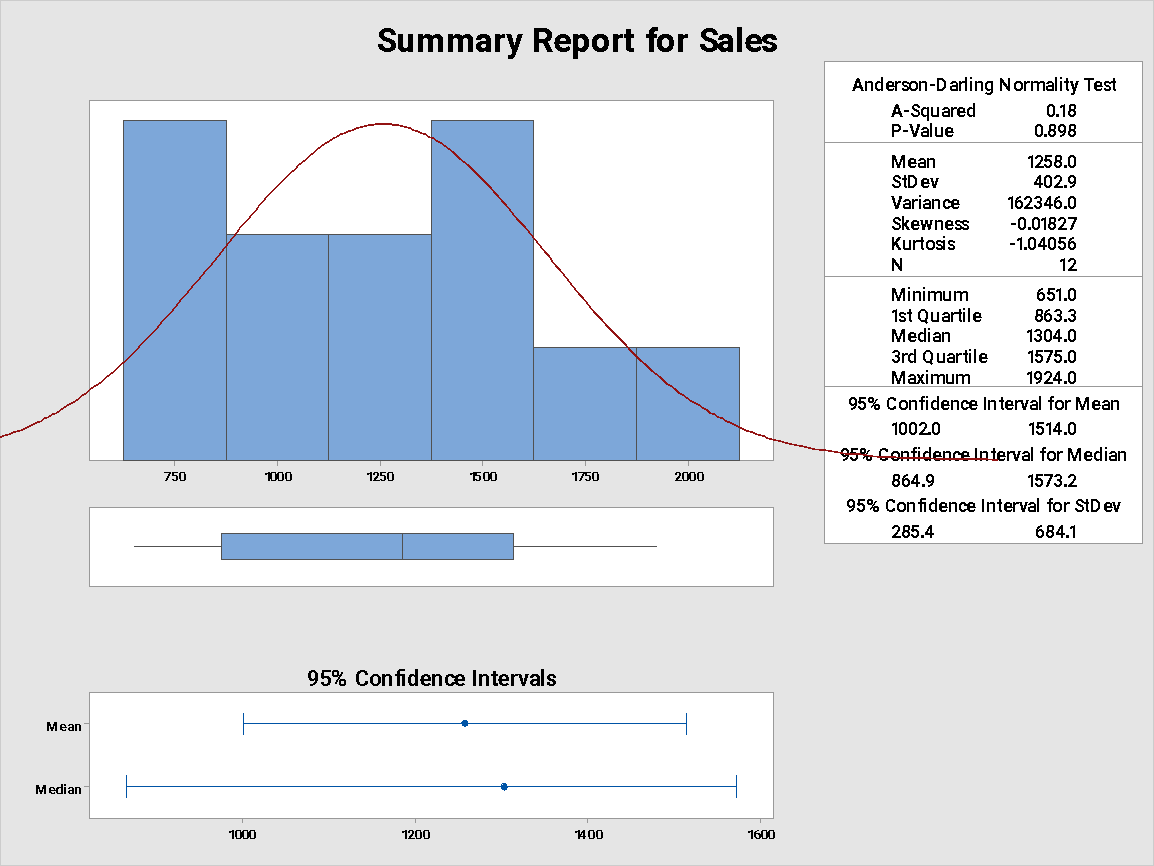
Figure 2- Histogram of Sales
As the histogram shows, average sales are $1258 and the standard deviation is $402.
- Scatter plot: Graph>Scatter plot

Figure 3 – Scatter plot (Sales vs. shelf space)
As the scatter plot shows, when shelf space increases and sales increase, there is a positive relation between shelf space and sales
- Correlation: Tool Bar Menu > Stat > Basic Statistics > Correlation
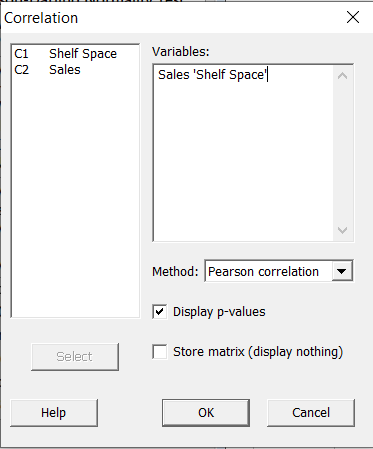
Figure 4-MINITAB steps to do Correlation
- Correlations: Shelf Space, Sales
- Pearson correlation of shelf space and sales = 0.978
- p-value = 0.000
- What is the decision?
- Pearson correlation or correlation coefficient
- The r value is 0.978 for the sample
- Does that mean ‘p’ is greater than zero? Or could it be that r = 0.978 due to chance variation while ‘p’ is still zero?
- What is the statistical interpretation?
- p-value (0.000) < α -risk (0.01) indicates that the null hypothesis should be rejected
- Infer Ha: sufficient evidence that there is a correlation between sales and shelf space
- Fitted Line Plot: Tool Bar Menu > Stat > Regression > Fitted Line Plot

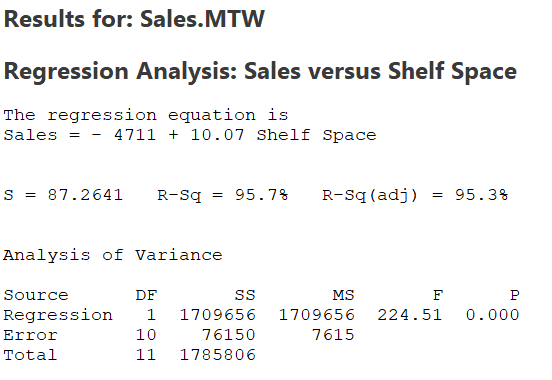
Figure 6- Regression analysis result
- Prediction: Tool Bar Menu > Stat > Regression > Regression > Predict
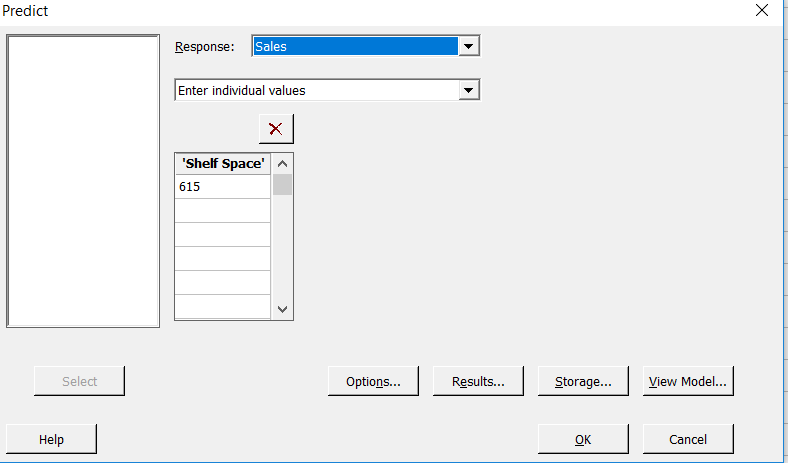
Figure 7: Predict sales by choosing the shelf face
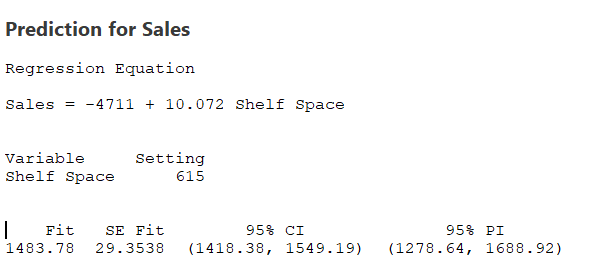
Figure 8: Prediction sales result
- We are 95% certain that sales will be between $1278.6 and $1688.9 when shelf space is 615 sq. in.
- In the example, the actual value was $1370.
What about R-squared?
- R-squared is a measure describing the quality of regression
- Measures the proportion of variation that is explained by the regression model
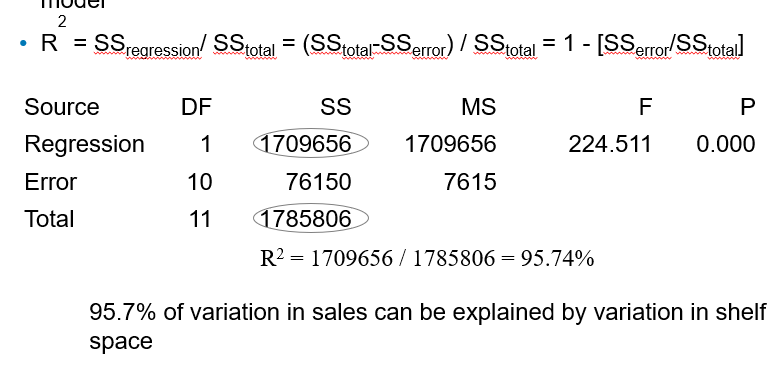
Figure 9- R-squared 95.74%(Variation)
- What is the R-squared on a regression with two data points?
- Does that mean a model with two data points is better?

Figure 10- R-squared 100% (No variation)
Please answer simple questions given below then compare your answers
Simple Regression – Example exercise 1
In regression, if the residual plots are not normally distributed, it implies a hypothesis test used to compare two or more than two population means is
- Outliers in data
- P value is low
- Non-parametric test should be used
- No outliers in the data
Simple Regression – Example exercise 2
The manager of the process claims that he suspects that the time to process an order is dependent on the experience of the process executives. Which hypothesis is appropriate to test his claim?
- T test
- Anova
- Mood Median
- Regression
Parametric test- Example exercise 3
Which test will be used in situations to find the strength of the relationship between two continuous variables?
- Correlation
- 2 sample T
- 2 proportion test
- Paired T
Answers for skills-building exercises
- The answer for the first sample exercise is 1
- The answer for the second sample exercise is 4
- The answer for the third sample exercise is 1
Conclusion
Use Simple Regression efficiently by keeping it simple. In addition, Simple Regression should only be used where appropriate and when there is sufficient quantity and quality of data to give the analysis meaning beyond your sample. The representation of a linear regression coefficient tells you whether there is a positive or negative correlation between each independent variable and the dependent variable. A positive coefficient indicates that as the value of the independent variable increases, the average of the dependent variable also tends to increase. The mean response is indicated in the 95% confidence interval in the fitted line plot. A single response is also indicated in the 95% prediction interval in the fitted line plot.
FAQS
What is the difference between DMAIC and DMADV?
DMAIC-The Process Improvement Methodology
DMADV-The Methodology for Process Design
What is the difference between lean and six sigma?
Lean improves the flow by eliminating waste.
Six sigma improves the process by reducing the variations.
Who gives the six-sigma certification?
Anexas Europe is one of the best overall Six Sigma Certification providers. It will open doors to many job opportunities all over the world.
How do you calculate demo in six sigma?
Count the defect opportunities outside the specification limits and then scale that number up to the equivalent of a million opportunities.
What is FMEA in Six Sigma?
A common tool for this analysis is failure mode and effects analysis. It will open doors to many job opportunities all over the world. By anticipating potential problems, you can often take countermeasures to reduce or eliminate the risks
Why Six Sigma certifications?
The Lean Six Sigma training helps in identifying risks, errors, or defects in a business process and removing them by approaching them in systematic, scientific, fact-based, and data-driven ways.
Who should learn Six Sigma?
Getting a Six Sigma course & certification generally requires individuals to have a certain level of experience and testify their expertise
How to get Six Sigma certifications free?
You can take your first step with Anexas Lean Six Sigma Free Yellow Belt training and enjoy the world of quality.
What is the advantage of a Master Black Belt in Lean Six Sigma?
The certified Master Black Belt Lean Six Sigma professional, your life will change completely. You can become self-employed, or get better salaries, advanced skill sets, better job profiles, and influential networks.
What are Lean Six Sigma certification levels?
These are various six sigma certification levels such as White Belt, Yellow Belt, Green Belt, Black Belt, Master Black Belt, and Champion