Nonparametric test is an important hypothesis analysis method that we use in Lean Six Sigma projects. This article will cover all the tips and tricks which will help you successfully understand the Nonparametric test for your process and clear the Lean six sigma certification exam.
What is a Nonparametric test?
A non-parametric test is a statistical test that is used when the population data belong to non-normal distribution. A non-parametric test in statistics does not assume that the data has been taken from a normal distribution. A normal distribution belongs to a parameterized family of probability distributions and includes parameters such as mean, variance, standard deviation, etc. Thus, a non-parametric test does not make assumptions about the probability distribution’s parameters.
Advantages of Non-parametric test
The benefit of non-parametric tests is that we do not assume that the data is derived from any particular distribution. However, if our assumptions are met, we get a robust result from parametric tests, but if the assumptions are violated, any conclusions drawn by using parametric tests are highly likely to be incorrect. Usually, the parametric methods rely on the assumption that the data come from a normally distributed population, in which case ANOVA and t-tests can be used. If this is not the case, however, or the data are non-numerical but are ranked, etc. non-parametric tests can be used.
Difference between Parametric and Non-Parametric Test?
The main difference between Parametric and Non-Parametric Tests is that the Parametric test is based on assumptions about the distribution of the population whereas the NonParametric test is not based on assumptions, it works on the sample data collected which doesn’t require distribution of population.
The following table defined the difference between parametric and non-parametric
| Non-Parametric Test | Parametric Test |
| A non-parametric test is a statistical test that is used when the population data does not belong to a parameterized distribution. | It is used when the data belongs to a specific probability distribution such as a normal distribution. |
| Knowledge of the population is not required to conduct this test. | Complete knowledge of the population is required. |
| The median is used for non-parametric tests. | The mean is used for parametric tests. |
| It is used for ordinal data and nominal data. | It is used for ordinal data and nominal data. |
| Less powerful | More powerful than nonparametric tests. |
| Examples of non-parametric tests are the signed test, the Kruskal Wallis test, etc. | Examples of parametric tests are the z test, t-test, etc. |
How to find data that is non-normal?
The Anderson-Darling Goodness of Fit Test (AD-Test) measures how well your data fits a specified distribution. It’s commonly used as a test for normality. When the data is non normally distributed, Anderson darling normality test P-value will be less than 0.05

List of the non-parametric tests.
- 1 sample Sign
- 1 Sample Wilcoxon
- Mann-Whitney
- Mood’s Median/
- Kruskal Wallis Test
1 sample sign test
The 1 sample sign test is a nonparametric hypothesis test used to determine whether a statistically significant difference exists between the median of a non-normally distributed continuous data set and a target data. This test generally concerns the median of a continuous population.
Consider the situation where a company sets a yearly target for the vendor yield is 85%. The median vendor yield for the last 12 months is 93%. They have been obtained from company records and the companies want to compare these results against the target by using 1 sample sign test. Because the sample of vendor yield is not normally distributed and there is only one sample to compare against the KPIs
Null Hypothesis: H0: The difference in the median is non-significant.
Alternate Hypothesis: Ha: The difference in the median is significant.
1 sample Wilcoxon test
The one-sample Wilcoxon signed rank test is a non-parametric alternative to the one-sample t-test when the data cannot be assumed to be normally distributed. It’s used to determine whether the median of the sample is equal to a known standard value (i.e. theoretical value). 1 sample sign tests allow you to compare the median of just one sample against a known median value, such as an industry benchmark or well-established historical mean.
Consider the situation where a recruitment consultancy has recently implemented a new salary negotiation process and a project team is trying to verify that it has improved (increased) the salaries that are being achieved. The salaries of the first 20 placements made using the new negotiation process have been recorded and the project team wants to compare these results against the benchmark. Because the sample of salaries is not normally distributed and there is only one sample to compare against the benchmark.
Mann Whitney test
The Mann Whitney test was initially developed by Wilcoxon hence it is also known as the / Wilcoxon rank sum test. This is used when we want to compare two independent samples, and the assumptions underlying the t-test are not met.
Consider the situation where a psychologist wants to compare the reaction times of people to two drugs. Randomly people are assigned to groups where the first group receives drug A, and the other receives drug B. To compare the probability distributions of group A and B, the reaction times in each group are recorded and pooled, the rank of each observation in the pooled sample is then recorded. The test statistic is the rank sum of the smaller group and the following hypothesis can then be tested.
H0 The probability distributions of the groups for each of the two products (in our case drugs) are identical.
H1 The probability distributions of the groups differ, (either one sided or two-sided alternatives can be considered.)
Kruskal Wallis test
The Kruskal Wallis test is a non-parametric technique for comparing two or more than two populations, i.e. analogous to ANOVA. Just as in the case of two independent samples the ranks are computed for each observation according to the relative size of the measurements when the data for all the samples are combined. The test statistic is computed which is a function of the rank sums for each sample, and the following hypothesis is tested.
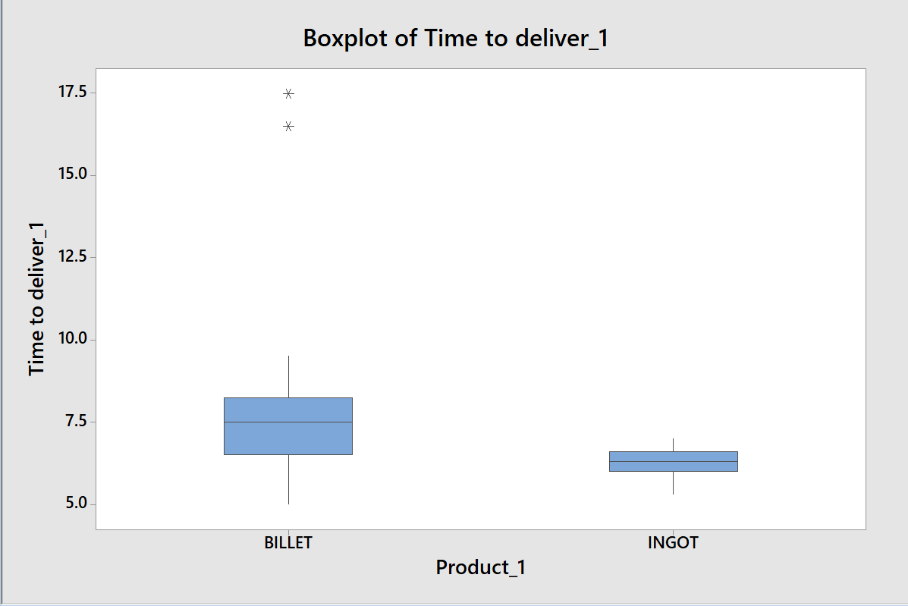
Consider the situation where a project is looking at the time to deliver different products (INGOT and BILLET). The box plot below shows that the INGOT product appears to be delivered quicker than BILLET, and the team are keen to validate this conclusion before other tools (such as detailed process mapping) are used to find out why. Because the INGOT results do not appear to be normally distributed (a histogram and Box plot both indicate a skewed distribution), a Kruskal-Wallis test is being used to compare the median values of the two samples.
Mood’s median test
Mood’s median test can be used to test the equality of medians from two or more than two populations and, like the Kruskal-Wallis Test, provides a nonparametric alternative to the one-way analysis of variance. Mood’s median test is sometimes called a median test or sign scores test. Mood’s median test tests:
H0: the population medians are all equal versus
H1: the medians are not all equal
An assumption of Mood’s median test is that the data from each population are independent random samples and the population distributions have the same shape. Mood’s median test is robust against outliers and errors in data and is particularly appropriate in the preliminary stages of analysis. Mood’s median test is more robust than is the Kruskal-Wallis test against outliers, but is less powerful for data from many distributions, including the normal.
Consider the situation where a project is looking at the time to deliver different products (INGOT and BILLET). The data has been stratified into two groups INGOT and BILLETS, and the box plot below shows that the INGOT product appears to be delivered quicker than BILLET. The team are keen to validate this before they set out to find and understand the root cause of this difference. Mood’s Median test is being used because the Billet data appears to be skewed and also has some outliers (the asterisks)
Please answer simple questions given below then compare your answers:
Nonparametric test – Example Exercise 1
What is the alternative non-parametric test to be used in its place of the 2-sample t test?
- Kruskal – Wallis
- Wilcoxon
- Mood’s Median
- Mann Whitney
Nonparametric test – Example Exercise 2
What is the non-parametric test to be used to test the equality of medians from two or more populations?
- Kruskal – Wallis
- Wilcoxon
- Mood’s Median
- Mann Whitney
The Nonparametric test – Example Exercise 3
What is the non-parametric test to be used for non-normally distributed continuous data set and target data?
- 1 sample sign test
- Kruskal – Wallis
- Mood’s Median
- Mann Whitney
Answers for skills-building exercises
- The answer for the first sample exercise is 4
- The answer for the second sample exercise is 3
- The answer for the third sample exercise is 1
Conclusion
If a sample size is reasonably large, the applicable parametric test can be used. However, if the sample size is too small, it is possible that you may not be able to validate the distribution of the data, Thus the application of a non-parametric test is the only suitable method. In addition, if a parametric test exists, it is more powerful than the non-parametric test. In other words, if all assumptions of a statistical model are satisfied by the data and if the measurements are of required strength, then the non-parametric tests are wasteful of time and data.