
The three most common measures of location are the mean, median, and mode. Each of these measures estimates the location of the middle point using a different method. The choice of a measure of central tendency is related to the type of data in hand. In statistics, a measure of location is a single value or number that attempts to describe or represent a data set by identifying the central position within that set of data. We can use a single value or number that attempts to describe or represent a set of data because most data tend to gather around central points.
Lean Six Sigma Green Belt Certification Measure of location is an important topic and needs attention. Read this article to understand everything about central tendency.
Read this blog to understand topics like mean, median, mode, and a lot more. The tips given below are specially designed by industry experts who have 30 years of experience. Read the blog carefully to grab a Measure of Location.
Measure of Location – How to solve
We have explained the mean, median and mode and their steps to understand the measure of location correctly. These tips were created by experts, and they are as follows-
Measure of Location- Mean, Median, Mode
1. Let us understand when to use the mean
- Often it is called the average, the mean is the most familiar measure of central tendency. It is the sum of all the data points divided by the number of data points.
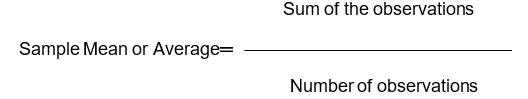
- For example, In this data set 3,4,5,2,1. The Sum of the observation is 15 and the number of observations is 5. Average is (15/5) 3.
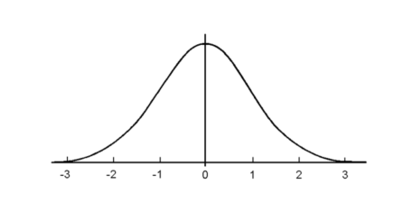
- When the data set is symmetrically distributed. Mean is a good measure.
- The sample mean is specified by the symbol x̅ (pronounced X-bar).
- To indicate that we are calculating the population mean, we use the Greek symbol “μ” (pronounced “mu”).
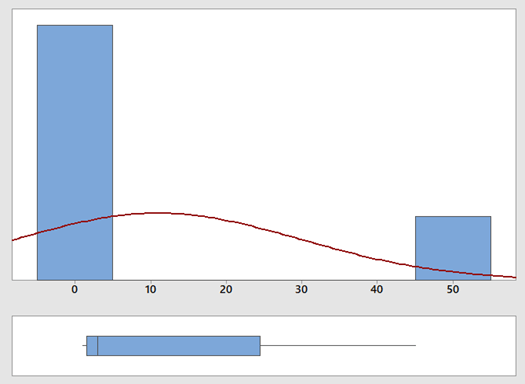
- If the data set with unusual points then the mean is not a good measurement. We must go with a median.
2. Let us understand when to use the median
- The Median is the middle number in a sorted list of numbers. It is the value that separates the higher half from the lower half of a data sample. The median is often used as different from the mean when there are outliers in the sequence that might skew the average of the values.
- For example, In this data sheet 3,4,45,2,1. Here outlier is 45. It may be due to special reasons. The Sum of the observation is 55 and the number of observations is 5. The mean is 11. Mean is not a good measurement to find the middle value.
- Arrange the values in descending or ascending order as 45,4,3,2,1 and
- Find the middle value of the data set. The upper half from the middle of the data is 50% and the lower half from the middle of the data is 50%.
- As per the above example, the midpoint of the data set is 3.
- If the data set is an even number. For example, 46, 5, 4,3,2,1. the median of the data set will be the mean of the middle two values within the data set.
- The middle two values are 4 and 3. Average of two middle values (4+3)/2=3.5. Therefore, the median is 3.5.
- When the data set is asymmetrically distributed. Median is a good measure.
3. Let us understand when to use the mode
- The mode is the most frequently occurring number in a data set. A set of numbers may have one mode or more than one mode.
- To find the mode, arrange the numbers in order of magnitude (from least to greatest), then count how many times each number occurs. The number that occurs the most is the mode.
- In the following example, an agency conducted a survey to find which party will be elected by the people for upcoming election. Agency has collected 500 samples. 150 of them chose Party A. 250 of them chose Party B and 50 of them chose Party C.
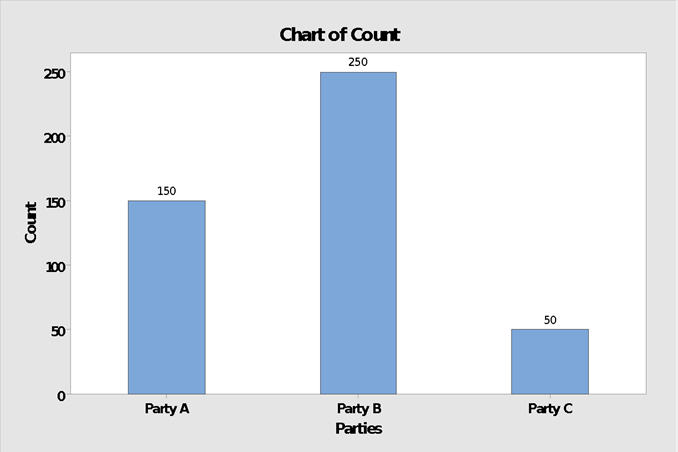
- In the above example mode is Party B because the highest number of people chose party B.
- The existence of more than one mode can limit the ability of the mode to describe the center or typical value of the distribution because a single value cannot be identified to explain the center.
How can measure of location be used?
Generally, whatever target is given to the process, the process will try to achieve that. And also, you can notice that it follows one value that is the centre of the process.
The mean, median, and mode are all effective measures of central tendency. However, some measures of central tendency become more appropriate to use than others under different conditions. Such as:
- The mean is the only measure of central tendency where the sum of the deviations of each value from the mean is always zero. On the other hand, the one main drawback of the mean is its weakness in the impact of outliers. As the data becomes skewed, the mean fails its ability to provide the best central location because the skewed data is dragging it away from the typical value.
- The median is less affected by outliers and skewed data. This property makes it a better option than the mean as a measure of central tendency.
- The mode has a benefit over the median and the mean because it can be calculated for both numerical and categorical (non-numerical) data. However, the mode has its limitations too. In some distributions, the mode may not reflect the centre of the distribution very well. The presence of more than one mode can limit the ability of the mode to define the center or typical value of the distribution because a single value cannot be identified to describe the centre. In some cases, particularly where the data are continuous, the distribution may have no mode. In such cases, it may be better to consider using the median or mean, group the data into suitable intervals, and find the modal class.
Centre of Location- Example exercise 1
The median for the following numbers (6, 3, 2, 5, 1, 8,7) is
Centre of Location- Example exercise 2
Determine the Mode for the following data set: 2 3 2 1 0 0 4 6 2 1 3 4 4 4
Centre of Location- Example exercise 3
The central tendency of the chart can be represented as
Answers for skills-building exercises
- The answer for the first sample exercise is: 5
- The answer for the second sample exercise is: 4
- The answer for the third sample exercise is: Mean, Median and Mode