Lean Six Sigma Control charts are one of the seven basic quality tools typically used in quality control analysis. It is a very important topic in the Lean Six Sigma Black Belt and needs to be understood in depth to be used successfully. Read the tips given below to get deep insights on control charts.
The control chart, first described by Walter A. Shewhart is a statistical process control chart, or an SPC chart which is one of the seven basic quality tools typically used in Six Sigma chart in quality control analysis. It is mostly used to understand how a change takes place in the processes over time as well as to determine the deviations in the quality of products. There are various types of control charts in Lean Six Sigma used depending on whether the data is continuous or attribute. The article given below will cover everything you need to know about control charts so that you can score well on the control charts topic.

Control charts – How to solve & tips
There are a total of 14 tips to complete Lean Six Sigma control charts correctly. These tips were designed by industry experts with over 30 years of experience in Lean Six Sigma. Let’s look at these control charts tips.
The Six Sigma DPMO chart offers a precise measure of process performance by quantifying defects occurring per million opportunities. This chart enables organizations to identify and track process inefficiencies over time, fostering a culture of continuous improvement and quality enhancement.

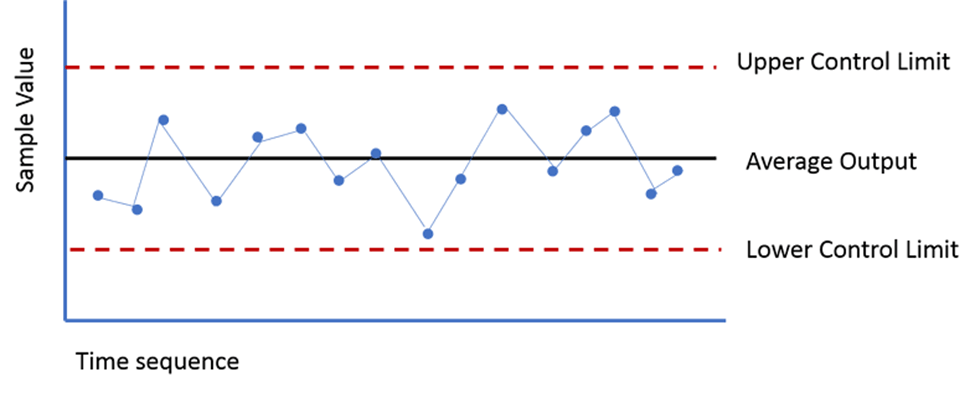
- There are 3 main elements of Lean Six Sigma control charts. A visual time series of Lean Six Sigma graph explanation that illustrates the data points collected at specific intervals of time. A horizontal control line is used to visualize the variations and trends more easily. A horizontal line is used to represent the upper and lower Six Sigma control limits, placed at equal distances above and below the horizontal control line. These upper and lower limits are calculated from the data that is recorded on the time series Lean Six Sigma graph over a specified period of time.
- There are various types of control charts available in Lean Six Sigma to use for different types of data and for specific purposes. There are many control charts like P chart, Np chart, U chart, C chart, I-MR chart, X bar R-chart, X bar S-chart, etc.
- Attribute data – When the data is an attribute or in countable form, then the following control charts are used: P chart, Np chart, U chart, C chart
Example of attribute data-number of defects, defective units, etc.
There are four process states in a Control Chart
- The Ideal state: where the process is in control and all the data points fall under the control limits. There is no non-conformance.
- The Threshold state: where the data points are in control, or the process is stable, however, some non-conformance happens over a period of time.
- The Brink of Chaos state: where the process is in control; however, it is on the edge of committing errors.
- The fourth state: where the process is Out of Control and we have some unpredictable non-conformance.
- The process can be out of control because of variations. There are 2 types of variations, Common Cause Variations & Special Cause Variations. Before making the control chart, it is necessary to understand these two types of process variation so that you can monitor whether your process is stable or not.
- Common cause variations: Common cause variations are predictable in nature and they are always present in the processes. When variations stay within the upper and lower limits, there is no urgent need to change the process because everything works within predictable parameters.
- For the control chart example in Lean Six Sigma, let us consider how long it takes you to commute to work every morning. You may drive the same route every morning, but the drive is never the same. Perhaps it takes you an average of 20 minutes from the time you leave your house until you pull into the parking lot. Due to common cause variations such as stop lights and traffic congestion, some days it takes less time and other days it takes more time. Even though you don’t know exactly when you will get to work tomorrow, you know that it will fall within an acceptable time frame and you will arrive on time.
- Special cause variations: Special cause variations are usually unpredictable in nature. For example, running out of fuel or vehicle failure could extend your journey by an hour or more, but these types of special causes do not happen every day. Whenever such variations occur in the process it is necessary to analyze what went wrong to determine if these can be prevented in the future or not.
- Benefits of using a control chart are that it gives a visual representation of an ongoing process, makes it easy to understand and interpret the process, helps in decision-making for various process improvement goals, and helps identify the type of variation in a process.
- To make a control chart, choose an appropriate control chart according to the type of data that needs to be collected. After that determine the appropriate time period for collecting the data which is typically noted on the X-axis of the control chart. Collect the necessary data of the process and establish the control limits.
- After collecting the data, plot it on the control chart and calculate the average of all collected data and add it as a control line. Then calculate the upper and lower control limits and add these lines in the control chart, you can use different colours or styles so that it can be understood easily.
- Once the control limits are marked on the control chart, note any “out-of-control signals,” or places where the data falls outside the calculated upper and lower control limits. If there is any variation in the data or the data is going out of the control limits, assign the cause to it, investigate that cause and adjust the process to minimise the risk of these abnormalities. With the help of these control limits, continue to track your process.
- Lean Six Sigma control charts rules say that control charts can be used to find out whether the process is stable or not, to know and understand the process variation over time, to determine if any variation has occurred and to fix it instantaneously and to examine whether the process is within the statistical control or not (Due to chance or assignable causes).
Also read: Lean Six Sigma Green Belt Certification FMEA
Control charts in Lean Six Sigma- Example exercise 1
In a control chart, control limits are
Control charts in Lean Six Sigma- Example exercise 2
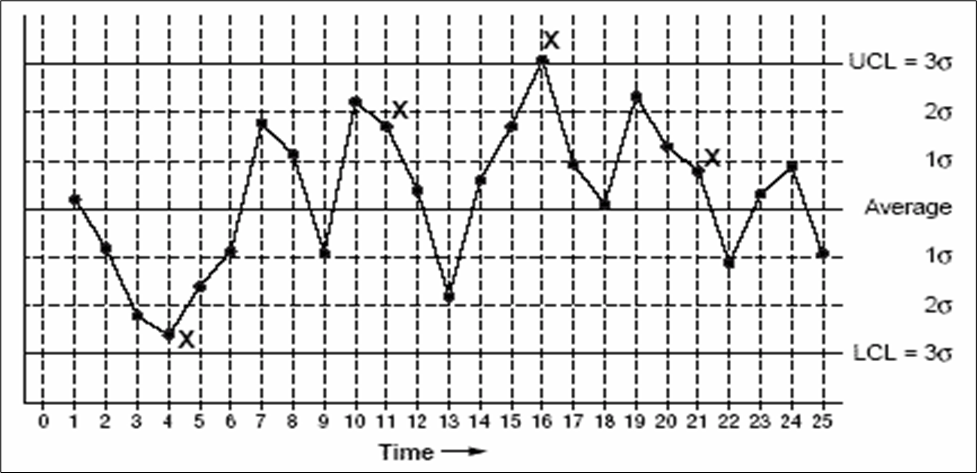
On a control chart, the lines plotted three standard deviations on either side of the centerline, or mean of data, define
Control charts in Lean Six Sigma- Example exercise 3
A Green belt is going to monitor the process by collecting 1 sample per group. Which of the following continuous control charts would be most appropriate?
Control charts in Lean Six Sigma- Example exercise 4
The prime use of a control chart is to
Answers for skills building exercises
Answer for the first sample exercise is : Calculated using sigma value because control limits are calculated by: Estimating the standard deviation, σ, of the sample data. Multiplying that number by three. Adding (3 x σ to the average) for the UCL and subtracting (3 x σ from the average) for the LCL.
Answer for the second sample exercise is : Control limit because a control chart always has a central line for the average, an upper line for the upper control limit, and a lower line for the lower control limit. These lines are determined from historical data.
Answer for the third sample exercise is : I-MR because an I-MR chart is a combination of control charts used to monitor the process variability (as the moving range between successive observations) and average (as the mean) when measuring individuals at regular intervals from a process.
Answer for the fourth sample exercise is : Detect assignable causes of variation in the process because Control charts enable us to determine the type of variation that exists in a process. A common problem in business is managers who treat all variation as if it were due to assignable causes.